


Opened 13 years ago
Last modified 4 years ago
#8786 new enhancement
display not only planned space of time as chart bar, but also really spent space of time
| Reported by: | falkb | Owned by: | Chris Nelson |
|---|---|---|---|
| Priority: | normal | Component: | TracJsGanttPlugin |
| Severity: | normal | Keywords: | |
| Cc: | Trac Release: | 0.12 |
Description
The chart displays bars for the planned time of a ticket. This lets us have a pretty look at what is the schedule which is very cool (like this plugin in general!).
To have a fast viewable comparison what we actually got in reality, I wish there was another bar for each ticket showing the space of time when the ticket really has been worked on.
- This is likely the time range between 'accepted' and 'closed'.
- Then both bars, for plan and reality, will be located in the same chart line.
- Plan bar and reality bar may overlap each other, partially or completely, depending on how much plan and reality differ.
- Note, if a ticket is reopened, we'll get more than one bar for the 'worked time'.
- Another way for finding the time spaces of real work may be by analyzing the timestamps and values of field 'hours' ("Add hours" of TimingAndEstimationPlugin).
Attachments (1)
Change History (5)
comment:1 Changed 13 years ago by
| Cc: | Ryan J Ollos added; anonymous removed |
|---|
Changed 13 years ago by
| Attachment: | ticket8786.PNG added |
|---|
comment:2 Changed 13 years ago by
comment:3 Changed 12 years ago by
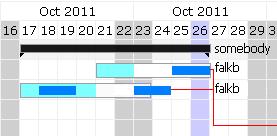
For using the TracJsGanttPlugin chart as project state review, it would be very helpful if the bars displaying the really worked time (which are blue in the picture above) are better multicoloured to reflect the ticket state. Each ticket state has a certain colour. This way the team can easily survey during which days a ticket was new, already accepted, in testing state, closed or reopened, and what the current state is. The ticket bar consists of several differently coloured sections then.
comment:4 Changed 4 years ago by
| Cc: | Ryan J Ollos removed |
|---|
This is a fictitious example how I mean it. You can see the cyan/white plan bar for how it was planned including its percentaged implementation status, and the blue discontinuous reality bar for when people really worked on the ticket.
The example lets us quickly recognize that the work on the tickets had started too late, and had been interrupted for some reasons in the second ticket, it's an overdrawn plan.