


#9040 closed defect (fixed)
Query Screen > Errors in aggregation
| Reported by: | Owned by: | Russ Tyndall | |
|---|---|---|---|
| Priority: | normal | Component: | TimingAndEstimationPlugin |
| Severity: | normal | Keywords: | |
| Cc: | Trac Release: | 0.12 |
Description
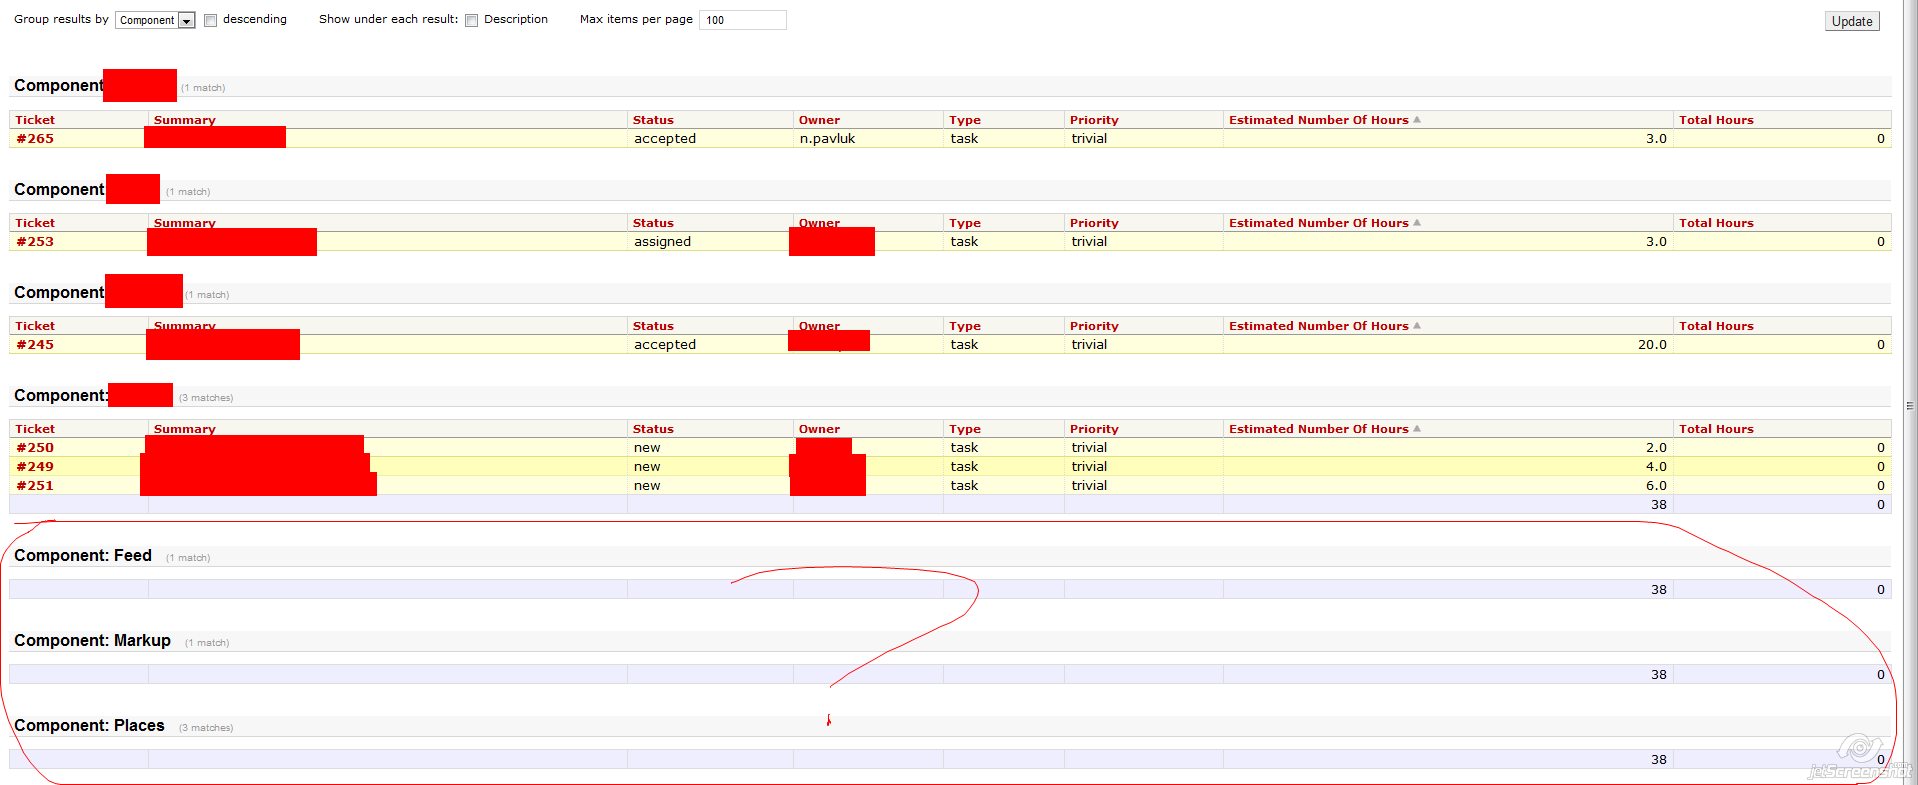
After i enable this plugin default trac reports (when i use grouping) got trash sections. See screenshot.
Attachments (2)
Change History (13)
Changed 13 years ago by
| Attachment: | 20110727-abp6-181kb.jpg added |
|---|
comment:1 Changed 13 years ago by
I cannot help with only the information provided. It looks like there are components that have no data (Such that the query produces empty sections), or that the sorting is wrong so that there are multiple copies of each component section.
I dont have this problem on any of my tracs, so it will be hard for me to fix (without being able to reproduce it).
It also looks like the hour totaler is not working correctly, but this could be some other ramification of reported bug.
Do you have any other information you could provide to help me sort this out?
- Database backend and version
- trac version and plugin version
- Component names (mostly I need to know if component names are displayed more than once or if there are duplicates)
- Anything else based on this information that might help me determine what is going wrong
thanks for the bug report, Russ
comment:2 Changed 13 years ago by
System Information
Trac 0.12.2
Babel 0.9.6
Docutils 0.7
Genshi 0.6
MySQL server: "5.1.58", client: "5.1.58", thread-safe: 1
MySQLdb 1.2.3
Pygments 1.4
Python 2.7.2 (default, Jul 18 2011, 09:52:12) [GCC 4.2.1 20070719 [FreeBSD]]
pytz 2011g
setuptools 0.6c11
SilverCity 0.9.7
Subversion 1.6.17 (r1128011)
jQuery: 1.4.2
Installed Plugins
timingandestimationplugin 1.1.6b /usr/local/lib/python2.7/site-packages/timingandestimationplugin-1.1.6b-py2.7.egg
Component names on that screenshot
Events
Feed
Markup
Places
Feed
Markup
Places
comment:3 Changed 13 years ago by
Also after i enabled trac-log i got this messages
2011-07-29 10:38:55,176 Trac[tande_filters] DEBUG: TicketFormatFilter executing
2011-07-29 10:38:55,176 Trac[tande_filters] DEBUG: TicketFormatFilter not the correct template
2011-07-29 10:38:55,176 Trac[tande_filters] DEBUG: Not a timeline, returning
comment:4 Changed 13 years ago by
Looking into it further, as best I can tell, the sort ordering of the reports is broken for, you. The total row is intended to show directly beneath the other rows rather than as its own new subsection.
The only thing I can think of is that the order by clause got lost / broken or behaves strangely in that version of mysql you are running. I dont usually run mysql, but I have a test instance installed and I installed the latest T&E plugin against it and the reports run / display fine. (It seems like it is sorting by _ord THEN __component__ rather than the other way around.)
This implies to me that it is something specific to your data, reports, or configuration. An easy fix is probably to remove the union clauses that add the total row from the reports (though you would not have the total anymore). Otherwise it would involve figuring out why the mysql sorter / grouper is returning results like that.
If you would rather debug, you could try unhiding the __component__ column by removing the leading and trailing __ to verify that the report could sort this correctly (add it to the parent select so you will be able to see the value __component__ in the output).
If you find anything more out about this please let me know as it will perhaps spark an insight.
Hope we get this fixed for you soon,
Russ
comment:5 Changed 13 years ago by
| Keywords: | waiting-for-feedback added |
|---|
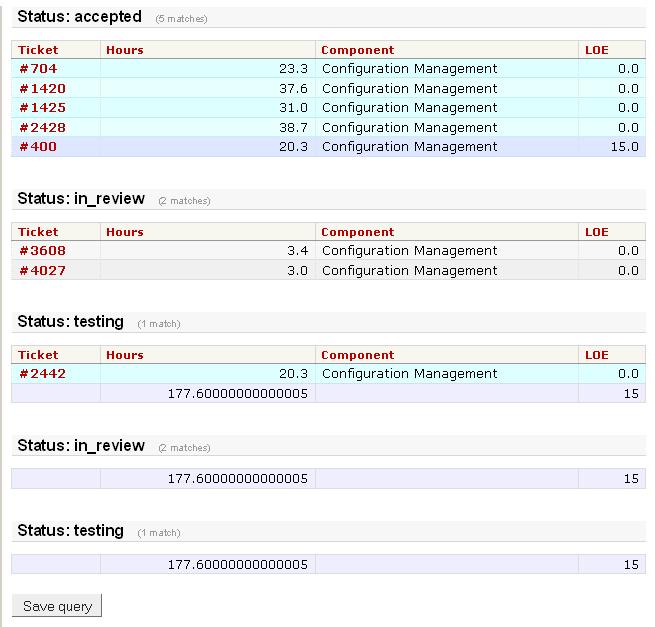
Changed 13 years ago by
| Attachment: | Trac_report_sample.jpg added |
|---|
Sample output with "Group results by" being used
comment:6 Changed 13 years ago by
I just added an attachment to this ticket where I am seeing the similar problem when I do a Custom Query and group the results. I selected only columns of interest to be displayed and narrowed my selections to a few tickets.
I recently added a second Subversion repository for Trac so I had to install a newer version of this plugin. I used timingandestimationplugin_branches_trac0.12-r10605.zip. This is when I first saw the problem.
I have it running on a test machine and on a production machine and seeing the same results on both.
Production:
System Information
Trac 	0.12.2
Genshi 	0.6
mod_python 	3.3.1
MySQL 	server: "5.0.77-community", client: "5.0.77", thread-safe: 1
MySQLdb 	1.2.2
Python 	2.5.1 (r251:54863, Sep 21 2007, 22:46:31) [GCC 4.2.1 (SUSE Linux)]
setuptools 	0.6c8
Subversion 	1.6.17 (r1128011)
jQuery:	1.4.2

Installed Plugins
AdvancedTicketWorkflowPlugin 	0.10dev 	/usr/local/trac/mistic/plugins/AdvancedTicketWorkflowPlugin-0.10dev-py2.5.egg
allattachments 	N/A 	/usr/local/trac/mistic/plugins/allattachments.pyc
BatchModify 	0.8.0-trac0.12 	/usr/local/trac/mistic/plugins/BatchModify-0.8.0_trac0.12-py2.5.egg
cc-selector 	0.0.3dev 	/usr/local/trac/mistic/plugins/cc_selector-0.0.3dev-py2.5.egg
mypermissions 	N/A 	/usr/local/trac/mistic/plugins/mypermissions.pyc
nevernotifyupdaterplugin 	0.0.9 	/usr/local/trac/mistic/plugins/nevernotifyupdaterplugin-0.0.9-py2.5.egg
TicketImport 	0.8 	/usr/local/trac/mistic/plugins/TicketImport-0.8-py2.5.egg
timingandestimationplugin 	1.1.4 	/usr/local/trac/mistic/plugins/timingandestimationplugin-1.1.4-py2.5.egg
TracMasterTickets 	3.0.1 	/usr/local/trac/mistic/plugins/TracMasterTickets-3.0.1-py2.5.egg
TracProgressMeterMacro 	0.3 	/usr/local/trac/mistic/plugins/TracProgressMeterMacro-0.3-py2.5.egg
Test:
System Information
Trac 	0.12.2
Babel 	0.9.5
Genshi 	0.6
mod_wsgi 	3.3 (WSGIProcessGroup WSGIApplicationGroup %{GLOBAL})
MySQL 	server: "5.1.44-community-log", client: "5.1.44", thread-safe: 1
MySQLdb 	1.2.2
Python 	2.6.2 (r262:71600, Oct 24 2009, 03:15:21) [GCC 4.4.1 [gcc-4_4-branch revision 150839]]
setuptools 	0.6c11
Subversion 	1.6.16 (r1073529)
jQuery:	1.4.2

Installed Plugins
AdvancedTicketWorkflowPlugin 	0.10dev 	/usr/local/trac/mistic/plugins/AdvancedTicketWorkflowPlugin-0.10dev-py2.6.egg
allattachments 	N/A 	/usr/local/trac/mistic/plugins/allattachments.pyc
BatchModify 	0.8.0-trac0.12 	/usr/local/trac/mistic/plugins/BatchModify-0.8.0_trac0.12-py2.6.egg
cc-selector 	0.0.3dev 	/usr/local/trac/mistic/plugins/cc_selector-0.0.3dev-py2.6.egg
mypermissions 	N/A 	/usr/local/trac/mistic/plugins/mypermissions.pyc
nevernotifyupdaterplugin 	0.0.9 	/usr/local/trac/mistic/plugins/nevernotifyupdaterplugin-0.0.9-py2.6.egg
TicketImport 	0.8 	/usr/local/trac/mistic/plugins/TicketImport-0.8-py2.6.egg
timingandestimationplugin 	1.1.4 	/usr/local/trac/mistic/plugins/timingandestimationplugin-1.1.4-py2.6.egg
TracMasterTickets 	3.0.1 	/usr/local/trac/mistic/plugins/TracMasterTickets-3.0.1-py2.6.egg
TracProgressMeterMacro 	0.3 	/usr/local/trac/mistic/plugins/TracProgressMeterMacro-0.3-py2.6.egg
TracSQL 	0.2 	/usr/local/trac/mistic/plugins/TracSQL-0.2-py2.6.egg
comment:7 Changed 13 years ago by
| Cc: | dale.miller@… added; anonymous removed |
|---|
comment:8 Changed 13 years ago by
| Keywords: | waiting-for-feedback removed |
|---|---|
| Summary: | Default reports strange behavior → Query Screen > Errors in aggregation |
Thanks for clearing this up for me. When originally reported talk of the "default reports" implied the reporting engine to me, not the custom "/query" screen. These are two different parts of trac, so I was not looking the in the correct place. Thus I was never able to actually duplicate this. I think with this new information, I can probably get this fixed pretty quickly on Monday.
Thanks for the more detailed report.
Russ
comment:9 Changed 13 years ago by
| Resolution: | → fixed |
|---|---|
| Status: | new → closed |
comment:10 Changed 13 years ago by
Please reopen if the new version of the plugin does not resolve this problem for you.
Cheers, Russ
comment:11 Changed 13 years ago by
| Cc: | anonymous added; dale.miller@… removed |
|---|
Thank you for fixing this. It is working now with Trac 0.12.2 with multiple repositories.
default reports with strange sections