


| Version 37 (modified by , 13 years ago) (diff) |
|---|
Contents
Tools for visualizing and quick editing of effort estimations
Description
EstimationTools includes macros that visualize remaining effort estimations, e.g., as Burndown Chart, as well as an extension that allows inline editing of estimations in the query view.
Usage
BurndownChart
Creates burn down chart for selected tickets.
This macro creates a chart that can be used to visualize the progress in a milestone (e.g., sprint or product backlog). For a given set of tickets and a time frame, the remaining estimated effort is calculated.
 [[BurndownChart([<query>,]<startdate>[,<enddate>][,<weekends>][,<title>][,<expected>][,<gridlines>]
      [,<width>][,<height>][,<color>][,<colorexpected>][,<bgcolor>][,<wecolor>])]]
Parameters
The macro has the following arguments and parameters:
| Argument | Plugin Version | Description | Default | Example |
query | a comma-separated list of query parameters for the ticket selection, in the form "key=value" as specified in TracQuery#QueryLanguage. | milestone=2011-05,owner=adrian
| ||
startdate | [Required] specifies the start date of the period [YYYY-MM-DD ISO-8601 format] | startdate=2011-05-10
| ||
enddate | end date of the period [YYYY-MM-DD ISO-8601 format] | In order (defaults on first given): milestones or completed date, or due date, or today | enddate=2011-05-30
| |
weekends | include weekends in chart [true, false] | true | weekends=false
| |
title | chart title [accepts non ASCII charset (i.e. à, ü, ñ ...)] | first milestone or Burndown Chart | title=Estimation Tools Plugin
| |
expected | show expected progress in chart [0 or any number to define initial expected hours] | 0 | expected=500
| |
gridlines | show gridlines in chart [0 or any number to define hour steps] | 0 | gridlines=100
| |
width | width of resulting diagram [px] | 800 | width=450
| |
height | height of resulting diagram [px] | 200 | height=150
| |
color | burn down graph color [RRGGBB] | ff9900 (a nice orange) | color=0099ff
| |
colorexpected | color for expected hours graph [RRGGBB] | ffddaa (a nice yellow) | colorexpected=ddffdd
| |
bgcolor | chart drawing area background color [RRGGBB] | ffffff | bgcolor=ccee10
| |
wecolor | chart drawing area background color for weekends [RRGGBB] | cccccc | wecolor=10bb20
|
- Note 1
- argument order it's not important.
- Note 2
[RRGGBB]it's a 6-letter string of hexadecimal values
- Examples:
-
[[BurndownChart(milestone=Sprint 1, startdate=2011-01-01)]] [[BurndownChart(milestone=Release 3.0|Sprint 1, startdate=2011-01-01, enddate=2011-01-15, weekends=false, expected=100, gridlines=20, width=600, height=100, color=0000ff)]] - Results:
-
HoursRemaining
Calculates remaining estimated hours for the queried tickets.
The macro accepts a comma-separated list of query parameters for the ticket selection, in the form "key=value" as specified in TracQuery#QueryLanguage.
[[HoursRemaining([<query>])]]
- Note 3
- argument it's not mandatory, if not given defaults to (T.B.D.)???
- Example:
Remaining effort to conclude this milestone: '''[[HoursRemaining(milestone=Sprint 1)]]''' hs.- Results:
- Remaining effort to conclude this milestone: 64 hs.
WorkloadChart
Creates workload chart for the selected tickets.
This macro creates a pie chart that shows the remaining estimated workload per ticket owner, and the remaining work days.
[WorkloadChart([<query>][,<width>][,<height>][,<color>])]]
Parameters
Supports the following parameters:
| Argument | Plugin Version | Description | Default | Example |
query | a comma-separated list of query parameters for the ticket selection, in the form "key=value" as specified in TracQuery#QueryLanguage. | milestone=2011-05,owner=adrian
| ||
width | width of resulting diagram [px] | 400 | width=450
| |
height | height of resulting diagram [px] | 100 | height=150
| |
color | pie chart starting set of color [RRGGBB] | ff9900 (a nice orange) | color=00ff00
|
- Note 1
- argument order it's not important.
- Note 2
[RRGGBB]it's a 6-letter string of hexadecimal values- Example:
-
[[WorkloadChart(milestone=Sprint 1, width=400, height=100, color=00ff00)]]
- Results:
-
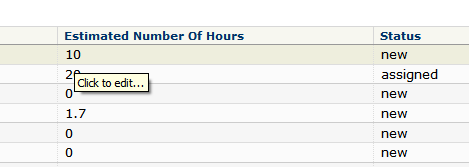
HoursInPlaceEditor
This component allows to edit the remaining hours field directly in the custom query view as well as in the report view.

- to show the remaining hours in the custom query view, you have to enable the corresponding column
- if you want to show the remaining hours column in your SQL reports, you need to join the ticket table with the ticket_custom table, which contains the custom fields.
SELECT
  ...                                    # normal SELECT statement
  id AS ticket,
  COALESCE(tc.value,'') as estimatedhours, # adds the value of estimatedhours in a column that must have same name original field
  FROM ticket t
  LEFT JOIN ...                          # other LEFT JOIN statements (in the default Trac queries) can be left in place
  LEFT JOIN ticket_custom tc ON tc.ticket = t.id and tc.name = 'estimatedhours'
  ...
- You could change
''to '0' to show 0 hours for tickets that don't have a corresponding estimated hours field. - Tickets may have an estimated hours field that is empty, in which case you may still see "blank"
- See #4549 for a more complex example
- You could change
viola: Using EstimationToolsPlugin, one can schedule tickets of a project with SchedulingToolsPlugin - try it!
Install
- Install
- Trac 0.11.x and Trac 0.12.x is supported in trunk.
- The latest version for Trac 0.10 can be checked out here.
- Manually: Deploy the egg:
   $ python setup.py bdist_egg
   $ cp dist/*.egg /path/to/trac/env/plugins
- Globally:
$ easy_install https://trac-hacks.org/svn/estimationtoolsplugin/trunk/
- Add a custom field into 'trac.ini' file to store the estimations for the current remaining effort, as follows:
[ticket-custom]
estimatedhours = text
estimatedhours.label = Remaining Hours
estimatedhours.value = 0
- Enable the plugin by updating TracIni file (..../trac.ini) as follows:
 [components]
 estimationtools.* = enabled
- Configure the plugin at its own configuration section, placed into 'trac.ini' file as follows:
[estimation-tools]
# if you want to use another field than estimatedhours you can change that
estimation_field = estimatedhours
# Set to a comma separated list of workflow states
# that count as zero in BurnDownChart. Defaults to 'closed'
closed_states = closed,another_state
# Suffix used for estimations. Defaults to 'h'
estimation_suffix = points
# If you want charts to be served from the server set to true. Useful for SSL connections. Default 'false'
serverside_charts = false
- Restart web server on command line:
$ sudo /etc/init.d/apache2 restart
Requirements
The charts use Google's Chart API, hence no additional python modules are required.
The HoursInPlaceEditor requires the XmlRpcPlugin.
Plugin Installation
Still in doubt? Please see Trac's plug-in installation instructions for more details.
Bugs/Feature Requests
Existing bugs and feature requests for EstimationToolsPlugin are here.
If you have any issues, create a new ticket.
Known issues
Planned enhancements
Source & Download
You can check out EstimationToolsPlugin from here using Subversion, or browse the source with Trac.
Download the zipped source from [download:estimationtoolsplugin here].
There is also an unofficial Debian package (source: orig.tar.gz debian.tar.gz dsc).
Recent Changes
- 17585 by rjollos on 2019-11-21 23:21:31
-
TracEstimationTools 0.6.0dev: Bump version after release
The plugin has been published to pypi:TracEstimationTools.
Fixes #13664.
- 17584 by rjollos on 2019-11-21 23:19:10
-
TracEstimationTools 0.5.0dev: Add
classifiersmetadata
Refs #13664.
- 16741 by rjollos on 2017-08-22 20:22:58
-
TracEstimationTools 0.5.0dev: Cleanup whitespace
(more)
Author/Contributors
Attachments (1)
-
HoursInPlaceEditor.png (4.0 KB) - added by 16 years ago.
Screenshot of HoursInPlaceEditor
Download all attachments as: .zip