


| Version 2 (modified by , 15 years ago) (diff) |
|---|
Trac is strong in basic, individual and small-team task management but lacks features for heavy-duty project management a la Microsoft Project, Project Manager Workbench, etc. This page discusses those missing features and how they can best be realized.
Gantt Charts
As discussed in two threads on the Trac Users mailing list, a fundamental requirement for project management is a Gantt chart to show work Breakdown Structure (WBS).
Trac has three Gantt chart plugins:
FlashGantt seems complex and stale.
GanttChart is a very simple Gantt chart implemented in a formatted text region. It is manually edited, not data-driven.
TracGantt has potential but has some funky fields (e.g., Due to Assign) that don't seem to be appropriate to what we want to do with a Gantt chart.
There is a Google Gadget Gantt chart which might be leveraged for the visualizations once the data is made available.
Requirements
Gantt Chart Components
In its most basic form, a Gantt chart shows:
- Tasks
- Self-contained units of work
- Dependencies
- Relationships between tasks that constrain when they can be done
- Milestones
- Dates by which one or more tasks must be completed
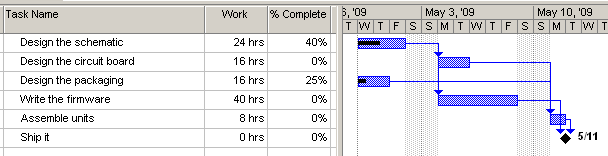
It may also show resource assignments and progress in tasks. It often includes a "today" line to show where a project stands. (If the project is on schedule, all tasks to the left of today are complete and any task that spans today has a progress bar to the right of today.)
A Gantt chart may also show slack time for tasks, how much they can slip before affecting the overall schedule.
Component Data
Each Gantt chart component or feature requires data to support it. For Trac-based project management, this data is often in addition to the core ticket data. Core ticket fields include:
- type (bug, task, enhancement, etc.)
- time (when the ticket was created)
- owner (who is working on it)
- reporter (who wrote the ticket)
- milestone (what milestone this ticket is part of)
- status (new, assigned, ..., closed)
- summary (short description)
Core milestone fields include:
- name
- due (date and time)
- completed (treated as a Boolean: open or closed)
- description
For a simple Gantt chart, we may use the following ticket fields:
- owner (the resource assigned to the task)
- milestone (when the task is due)
- summary (short description)
In addition, a task must have:
- estimate (expected work require to complete task)
- percent complete
- dependencies
While Gantt charts typically show percent complete, this can be computed from hours remaining vs. total estimate or hours worked vs. total estimate. We will not, necessarily, store percent complete. It is intuitive for display and analysis but difficult for data entry.
Dependencies
There are four general types of dependencies for tasks:
- Task B may have to start after task A. That is, B can't begin until A is done, perhaps because it uses a product of task A as a raw material.
- Task A may be composed of tasks B, C, and D. That is, tasks B, C, and D are subtasks of task A.
- Task A may have to start with task B (but they may end independently). For example, auditing someone's work may start when their work starts but may involve analysis and reporting after that work is done.
- Task A may have to end with task B (though they may start independently).
Each of these relationships has an inverse relationship in the other task.
- If B starts after A, then A ends before B.
- If A is composed of B, C, and D, then B, C, and D are part of A.
- If A starts with B, then B also starts with A.
- If A ends with B, then B also ends with A.
While generally useful, the starts with and ends with dependencies are somewhat more esoteric than the others and implementation may be deferred.
Draft garbage below this line. Still working with it...
dependencies (mastertickets does this fine)
estimates (timingandestimation is mostly ok, but needs computation logic a little more towards earned value)
recording of available resources (people in hours/week)
scheduling to show given all of the above when tasks are expected to be done
a way to show the schedule
A Gantt plugin for Trac should analyze ticket dependencies and produce an interactive, explorable Gantt chart showing task progress and project status.
By "project", I mean a set of related milestones. Perhaps a software project has a Design Phase, an Alpha Release, a Beta Release, and a General Release. Each would be a milestone with a target date and tickets to complete the work for that milestone. There must be a way to specify which milestones to include either listing explicitly or by giving a pattern or substring filter.
The chart should be able to show all tickets, though that may be a very complex chart.
or alternately all those tickets matched by a (query | report) or any other ticket group provider ;)
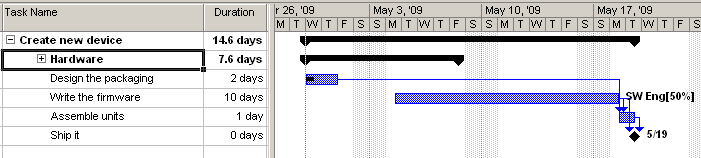
The chart should support interactively "folding" groups of tasks to hide detail.
Tasks/tickets in the chart should be links to the tickets they represent.
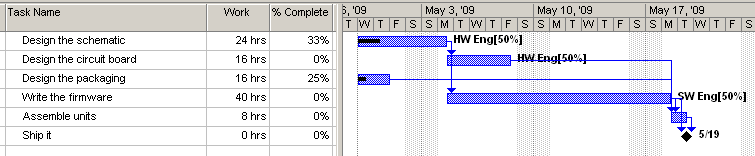
To effectively display project progress, tickets must have estimated and actual times as in the TimingAndEstimation plugin. Each task's bar in the chart should show actual hours.
The chart should have a Today line
Ticket dependencies that must be supported include:
- Task B must follow task A.
- Task A is composed of tasks B and C. A's estimated time is the total of B's and C's. (SubTickets)
- Tasks A and B start at the same time
- Tasks A and B must end at the same time
Type 1 dependency is implemented in the MasterTicket plugin. Note that a task may have many predecessors and many successors.
Type 2 dependency is necessary to support "folding" or "zooming" detail in the chart. It is also generally useful and might be implemented as its own plugin that the Gantt chart could require. Note that is should be possible to create a tree where A is composed of B and C, and B is composed of D and E, and C is composed of F, G, and H.
Types 3 and 4 are more unusual and a useful Gantt chart can be created without immediate support for these links in the first release.
It is also desirable to have loop detection to error-proof the tool used to create dependencies.
It would be nice to be able to choose an As Late As Possible or As Soon As Possible algorithm for laying out tasks.
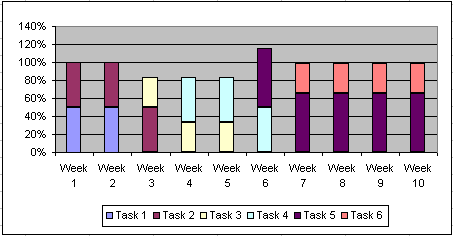
The chart (or an accompanying report or tool) should aid in resource leveling by (at least) showing overcommitted resources.
Related Work
MasterTickets
TimeingAndEstimation
TracHours
Disclaimer
The bulk of this page was prepared by Chris Nelson who makes no claim to be a certified project planner or anything of the sort. It is based on his understanding of project management after 25 years of software development.
Attachments (10)
-
simple-gantt.PNG (7.0 KB) - added by 15 years ago.
A simple Gantt chart
-
gantt-progress.PNG (7.9 KB) - added by 15 years ago.
Gantt chart with progress bars
-
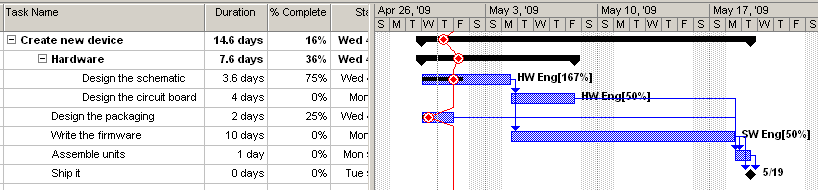
gantt-resource.PNG (11.0 KB) - added by 15 years ago.
Duration longer than work due to resources
-
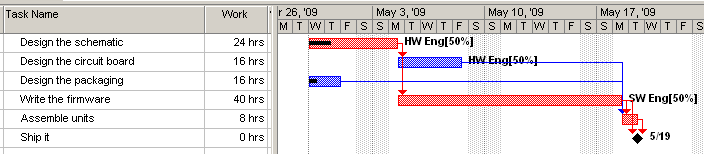
critical-path.PNG (9.9 KB) - added by 15 years ago.
Critical path
-
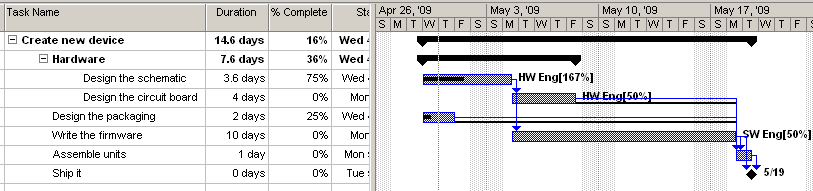
roll-up-1.PNG (12.7 KB) - added by 15 years ago.
Rolling up subtasks - 1
-
roll-up-2.PNG (9.6 KB) - added by 15 years ago.
Rolling up subtasks - 2
-
resource-utilization.PNG (5.9 KB) - added by 15 years ago.
Resource utilization chart
-
today.PNG (15.9 KB) - added by 15 years ago.
Gantt w/ "today" (progress) line
-
slack.PNG (15.4 KB) - added by 15 years ago.
Slack time illustration
-
progress-line.PNG (15.9 KB) - added by 15 years ago.
Progress line
Download all attachments as: .zip