


| Version 1 (modified by , 17 years ago) (diff) |
|---|
TimeVisualizerPlugin
Notice: This plugin is unmaintained and available for adoption.
Description
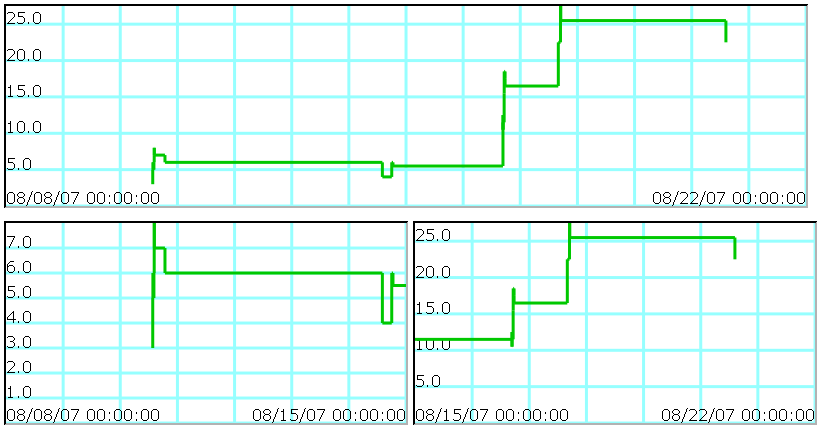
This component draws customizable burndown graphs from ticket history provided by TimingAndEstimationPlugin. Dynamic graphs can be easily embedded to wiki pages.
Bugs/Feature Requests
Existing bugs and feature requests for TimeVisualizerPlugin are here.
If you have any issues, create a new ticket.
Download
Download the zipped source from [download:timevisualizerplugin here].
Source
You can check out TimeVisualizerPlugin from here using Subversion, or browse the source with Trac.
Example
BurnDown macro renders the image
Recent Changes
- 14861 by rjollos on 2015-08-06 02:37:43
-
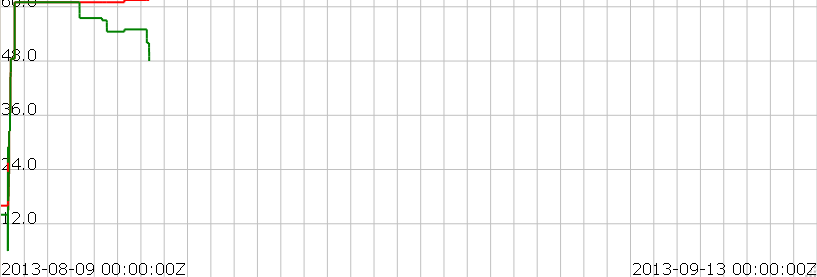
0.7: Adds support for multiple lines and makes it possible to specify the color and with of the lines and the grid.
This is an untested patch that was previously attached the project wiki page.
- 14860 by rjollos on 2015-08-06 02:37:36
-
0.7: Created branch for 0.7.
- 3323 by mape on 2008-03-07 17:01:28
-
Applied patch, which fixes logging issue with cgi frontend, closes #2666
(more)
Author/Contributors
Author: mape
Contributors:
Attachments (2)
-
TracTimeVisualizerPlugin_ss1.PNG (22.5 KB) - added by 17 years ago.
example burndowns
-
0.7_screenshot.png (15.2 KB) - added by 11 years ago.
0.7 screenshot with multiple lines
Download all attachments as: .zip