


| Version 8 (modified by , 13 years ago) (diff) |
|---|
Contents
Trac jsGantt plugin
Description
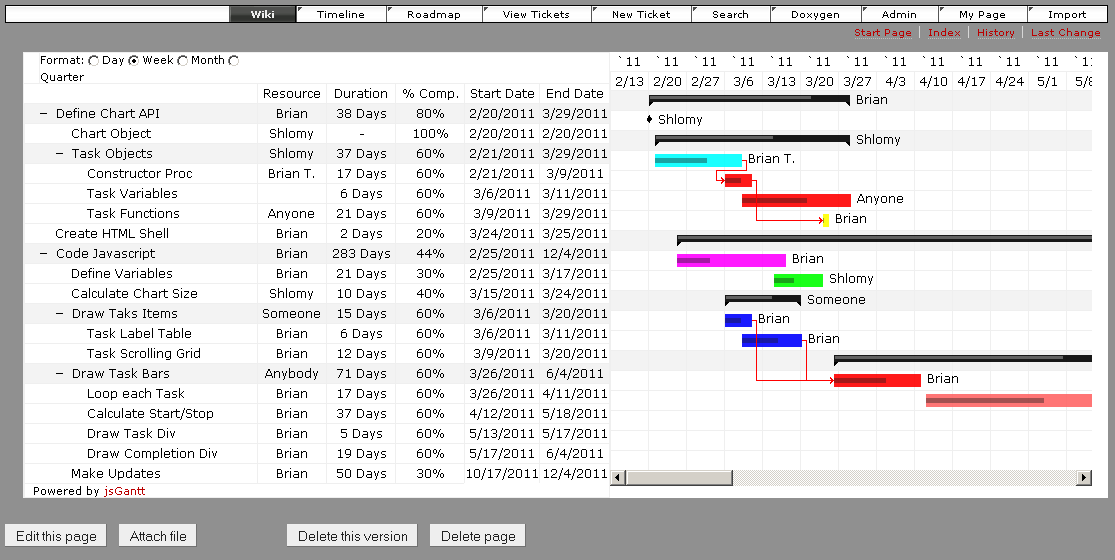
A plugin which allows Trac ticket data to be displayed in a jsGantt chart in a wiki page. Tasks and milestones are links to the corresponding ticket or milestone.
Bugs/Feature Requests
Existing bugs and feature requests for TracJsGanttPlugin are here.
If you have any issues, create a new ticket.
Download
Download the zipped source from [download:tracjsganttplugin here].
Source
You can check out TracJsGanttPlugin from here using Subversion, or browse the source with Trac.
Installation
- Download the source and run:
python setup.py bdist_egg
- Install it in one of the following ways:
cp dist/*.egg path/to/trac/env/plugins
easy_install dist/*.egg
- Enable the plugin in
trac.inias follows:[components] tracjsgantt.* = enabled
Example
[[TracJSGanttChart(milestone=Test)]] displays all the tickets in the Test milestone. [[TracJSGanttChart(sample=1)]] displays the sample project from jsgantt.com.

Configuration
Trac-jsGantt is intended to be flexible enough to get data from various plugins by configuring the field names for those plugins in trac.ini. It is known to work with TimingAndEstimationPlugin (for estimated and total hours), MasterTicketsPlugin (for FS dependencies), and Subtickets for parent/child relationships. Custom fields for start and finish date are also supported.
Tasks are colored based on ticket priority consistent with the colors used in Trac reports.
Your trac.ini may include:
[trac-jsgantt]
# To work with Timing and Estimation for percent complete
fields.estimate = estimatedhours
fields.worked = totalhours
# To work with Master Tickets for dependencies
fields.pred = blockedby
fields.succ = blocking
# To work with Subtickets for parent/child relationships
fields.parent = parents
# Custom fields for start and due dates
fields.start = userstart
fields.finish = userfinish
#
date_format = %Y-%m-%d
milestone_type = milestone
All of the fields.* items name custom fields which may contain data for the Gantt.
When estimate and worked are both configured, the plugin attempts to display (100 * worked/estimate) as the percent complete. The example works with TimingAndEstimationPlugin. Alternatively, if percent is configured, the plugin attempts to display it as the percent complete (it should be a number from 0 to 100). If none of those are configured, all tasks will be marked as 0% complete.
When pred and succ are configured the plugin uses them to determine the task dependencies. The example works with MasterTickets plugin. If these fields are not configured, no dependencies are shown.
When parent is configured, it is the field which holds the parent ticket number. The example works with Subtickets. If this field is not configured, no parent/child relationship will be displayed. If it is configured, the Gantt can be collapsed by the user to show or hide subtasks.
When start and finish are configured, the plugin uses them to set task start and finish dates. The date_format field is a Python strptime() format specifier which describes the contents of start and finish. If these fields are not configured, all tasks end today and have a 1-day duration.
The milestone_type may be used to have a custom ticket type show up as milestones on the chart. If this field is not specified, only Trac milestones are displayed as milestones.
Arguments
The chart display can be controlled with a number of macro arguments:
- format - Initial display format: day (default), week, month, or quarter
- sample - Display sample tasks (1) or not (0; default)
- res - Show resource column (1; default) or not (0)
- dur - Show duration colunn (1; default) or not (0)
- comp - Show percent complete column (1; default) or not (0)
- caption - Caption to place to right of tasks: None, Caption, Resource (default), Duration, %Complete
- startDate - Show start date column (1; default) or not (0)
- endDate - Show end date column (1; default) or not (0)
- dateDisplay - Date display format: 'mm/dd/yyyy' (default), 'dd/mm/yyyy', or 'yyyy-mm-dd'
- openLevel - Number of levels of tasks to show. 1 = only top level task. 999 is the default.
- colorBy - Field to use to choose task colors. Each unique value of the field will have a different color task. Defaults to priority. Other likely useful values are owner and milestone but any field can be used.
All other macro arguments are treated as TracQuery specification (e.g., milestone=MS1|MS2) to control which tickets are displayed.
Known issues
- Ticket status and type are not displayed.
- Only one chart can be displayed per page.
- The pop-up window displayed when you click a task or milestone is quite small.
Planned enhancements
- Allow configuration of default task duration.
Recent Changes
- 17888 by rjollos on 2020-12-03 05:44:28
-
Trac-jsGantt 1.2.0.0dev: Fix typo in section name
- 17707 by rjollos on 2020-04-29 19:05:19
-
Trac-jsGantt 1.2.0.0dev: Handle milestone with no tickets
Refs #13627.
- 17638 by jun66j5 on 2019-12-19 18:34:55
-
Trac-jsGantt 1.2.0.0dev: make compatible with Trac 1.4 (closes #13713)
(more)
Author/Contributors
Author: ChrisNelson
Maintainer: ChrisNelson
Contributors:
Attachments (1)
-
jsGanttSample.PNG (45.6 KB) - added by 13 years ago.
jsGantt sample tasks in a wiki page
Download all attachments as: .zip