


| Version 6 (modified by , 16 years ago) (diff) |
|---|
Trac Ticket Statistics
Notice: This plugin is unmaintained and available for adoption.
Description
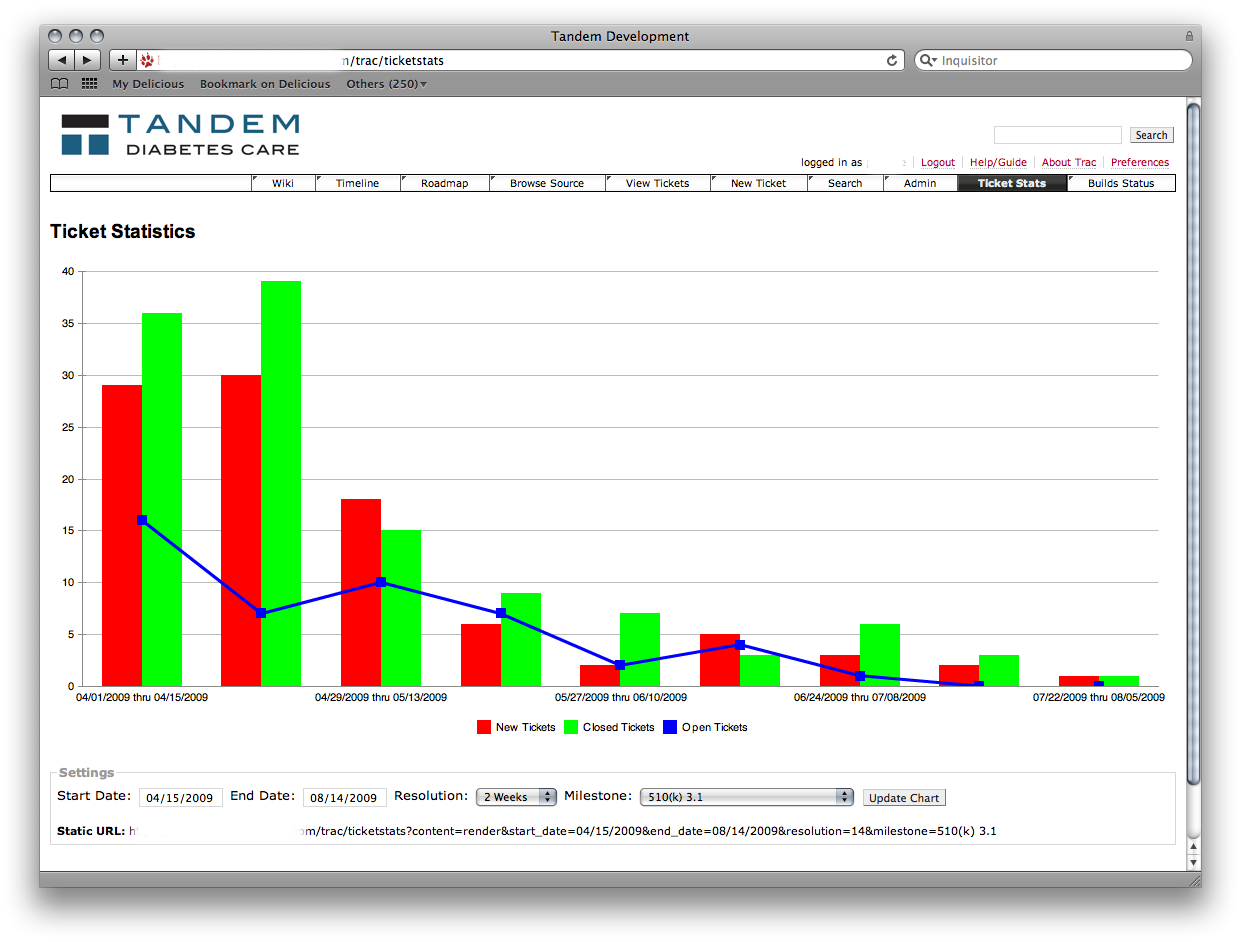
TracTicketStatsPlugin visualizes Trac ticket statistics. It plots the number of open tickets, the number of new tickets and the number of tickets closed. This plugin is written for Trac 0.11.
Other Technologies Used
- YUI Charts http://developer.yahoo.com/yui/charts/
YUI Charts is used to render the graph.
Screenshots
http://trac-hacks.org/attachment/wiki/TracTicketStatsPlugin/screenshot.png This screenshot shows what v1.0 of the plugin looks like.
http://trac-hacks.org/attachment/wiki/TracTicketStatsPlugin/%20mouseover.png Mouse-over the elements on the graph to see the exact data points.
Permissions
This plugin adds the permission TSTATS_VIEW. User must have this permission to view the ticket statistics page.
Bugs/Feature Requests
Existing bugs and feature requests for TracTicketStatsPlugin are here.
If you have any issues, create a new ticket.
Download
Download the zipped source from [download:tracticketstatsplugin here].
Download the egg from here
Source
You can check out TracTicketStatsPlugin from here using Subversion, or browse the source with Trac.
Example
This plugin can be used to visualize the progress of a project by seeing the rate of tickets being created vs. tickets being closed. Graphs can be customized.
Recent Changes
- 17239 by rjollos on 2018-07-15 01:04:06
-
Tracticketstats 3.0.0dev: Fix typo in template var
Refs #13231.
- 17237 by rjollos on 2018-07-08 20:21:21
-
Tracticketstats 3.0.0dev: Optimize redraw
Refs #13450.
- 17236 by rjollos on 2018-07-08 20:15:24
-
Tracticketstats 3.0.0dev: Modify macro to use
plotly
Refs #13450.
(more)
Author/Contributors
Author: Prentice Wongvibulsin echo0101
Contributors:
Attachments (1)
-
screenshot01.png (128.8 KB) - added by 15 years ago.
Screenshot of v2.1 on our dev server.
Download all attachments as: .zip