


| Version 11 (modified by , 15 years ago) (diff) |
|---|
Trac is strong in basic, individual and small-team task management but lacks features for heavy-duty project management a la Microsoft Project, Project Manager Workbench, etc. This page discusses those missing features and how they can best be realized.
Gantt Charts
As discussed in two threads on the Trac Users mailing list, a fundamental requirement for project management is a Gantt chart to show work Breakdown Structure (WBS).
Trac has three Gantt chart plugins:
- FlashGantt
- seems complex and stale.
- GanttChart
- is a very simple Gantt chart implemented in a formatted text region. It is manually edited, not data-driven.
- TracGantt
- has potential but has some funky fields (e.g., Due to Assign) that don't seem to be appropriate to what we want to do with a Gantt chart.
There is a Google Gadget Gantt chart which might be leveraged for the visualizations once the data is made available (e.g. using TracGViz plugin). That widget is developped and maintained by a company (i.e. ViewPath). Besides users need access to the internet and their projects environments have to be available too so that the iGoogle container be able to retrieve the data to display in the chart. All this means that local deployments (intranets, ...) are not possible.
Requirements
Gantt Chart Components
In its most basic form, a Gantt chart shows:
- Tasks
- Self-contained units of work
- Dependencies
- Relationships between tasks that constrain when they can be done
- Milestones
- Dates by which one or more tasks must be completed
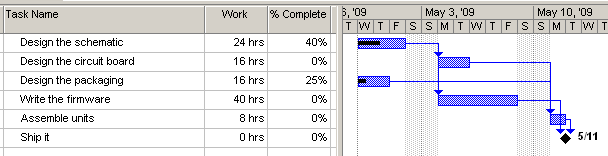
It may also show resource assignments and progress in tasks. It often includes a "today" line to show where a project stands. (If the project is on schedule, all tasks to the left of today are complete and any task that spans today has a progress bar to the right of today.)
A Gantt chart may also show slack time for tasks, how much they can slip before affecting the overall schedule.
Component Data
Each Gantt chart component or feature requires data to support it. For Trac-based project management, this data is often in addition to the core ticket data.
Core Fields
Core ticket fields include:
- type (bug, task, enhancement, etc.)
- time (when the ticket was created)
- owner (who is working on it)
owner is duplicated. Is it core or additional field ?
- reporter (who wrote the ticket)
- milestone (what milestone this ticket is part of)
- status (new, assigned, ..., closed)
- summary (short description)
Core milestone fields include:
- name
- due (date and time)
- completed (treated as a Boolean: open or closed)
- description
Additional Data
For a simple Gantt chart, we may use the following ticket fields:
- owner (the resource assigned to the task)
- milestone (when the task is due)
- summary (short description)
In addition, a task must have:
- estimate (expected work require to complete task)
- percent complete
- dependencies
It may also prove useful to note that a resource may not be applied 100% to a task.
Timing
While Gantt charts typically show percent complete, this can be computed from hours remaining vs. total estimate or hours worked vs. total estimate. We will not, necessarily, store percent complete. It is intuitive for display and analysis but difficult for data entry.
Dependencies
Project management generally involves four types of dependencies between tasks or activities:
- Finish-to-Start (FS)
- Task B cannot begin until task A is complete. This is the most common. When building a house, the walls cannot be put up until the foundation is complete.
- Start-to-Start (SS)
- Task B cannot begin until after task A begins (though they may end independently). When building a house, interior painting cannot begin until the dry wall is started. (Each room can be painted as soon as its dry wall is up.)
- Finish-to-Finish (FF)
- Task B cannot end until task A ends (though they may begin independently). When building a house, inspections cannot be completed until construction has completed (though parts may be inspected before the whole job is done).
- Start-to-Finish (SF)
- Task B cannot end until Task A begins. When building a house, the builder may begin getting interim payments during construction but payment will not be completed until the owner can start moving in.
In addition, managing the complexity of a large project requires breaking large tasks into smaller ones (or viewing groups of small tasks as larger aggregates). For example, interior painting might be broken down into paint the living room, paint the dining room, etc.
While useful, the FF and SF dependencies are somewhat more esoteric than the others and implementation may be deferred.
NOTE: The relationships are directional and inverting them is not straightforward. If A has a FS dependency on B, it is not true that B has an SF dependency on A.
Features
A Gantt plugin for Trac should analyze ticket dependencies and produce an interactive, explorable Gantt chart showing task progress and project status.
By "project", I mean a set of related milestones. Perhaps a software project has a Design Phase, an Alpha Release, a Beta Release, and a General Release. Each would be a milestone with a target date and tickets to complete the work for that milestone. There must be a way to specify which milestones to include either listing explicitly or by giving a pattern or substring filter.
What do we need in the back end ?
The chart should be able to show all tickets (though that may be a very complex chart) or alternately all those tickets matched by a (query | report) or any other ticket group provider.
To effectively display project progress, tickets must have estimated and actual times as in the TimingAndEstimation plugin.
It is also desirable to have loop detection to error-proof the tool used to create dependencies.
It would be nice to be able to choose an As Late As Possible or As Soon As Possible algorithm for laying out tasks.
What do we need in the user interface ?
A "chart these" button on a report page would be very nice.
Tasks in the chart should be links to the tickets they represent (preferently opened in a separate tab | window).
Milestones should be displayed in the chart as well
The chart should support interactively "folding" groups of tasks to hide detail.
Zooming in order to see the WBS in more detail
Panning or scrolling in order to display the schedule at a different time.
Each task's bar in the chart should show actual hours.
The chart should have a Today line
The chart (or an accompanying report or tool) should aid in resource leveling by (at least) showing overcommitted resources.
Visual indications about delays, task completion and other significant events
Drag n' Drop so that users can change the order of the tickets (yes, I'm drunk ... hip .o: )
Related Work
MasterTicketsPlugin supports FS dependency (but calls it blocks and blocked by).
The SubTickets page talks about adding composition type dependency. Can this be done in a plugin like MasterTickets or must it be in the core?
TimingAndEstimationPlugin and TracHoursPlugin add estimated and actual hours fields to tickets. There is some disagreement about whether the estimate is the remaining time (so total estimated time is actual + estimate) or total time (so remaining time is estimate - actual). A Gantt chart typically wants estimate and percent complete. It is possible to extract this from either recording convention and we should likely allow either convention via a configurable interface.
Design guidelines
In order to agree about how to implement this functionality, the very first step should be to describe the possible architectures (i.e., how the different components are going to interact with each other since the moment the request is sent by the client until the Gantt chart is rendered by the browser) that will be considered.
Components
In order to add flexibility to the final solution, the MVC pattern should be considered during its development. Hence the following components need to be implemented in order to add Gantt charts to Trac.
The Model
It provides the data in the Gantt chart and is not just a single element but a set of components like the following :
- The ticket models, which provide data about the issues found in the project environment
- Trac query mechanism which provides a way to select (filter) the tickets being shown.
- Other plugins used to track ticket dependencies
- Other plugins used to track task/subtask relationships
- Other plugins used to estimate the time needed to finish the given tasks
- Maybe one (a few) component(s) whose role is to provide the functionality specific to Gantt charts, thus acting as a central access point and a mediator so as to put all the other components together.
The View
It should be a JavaScript component (is this possible ?) responsible for rendering the data provided by the model. Besides it might support other dynamic features
The Controller
¿What do we need this for?
Implications
The aforementionned separation should allow the replacement of any of the components involved. Hence the following modifications should be made easily (the list being intentionally incomplete) :
- Replace the JS-based view by another made with Flash.
- Use a custom, or specific estimation strategy.
Roadmap
There seems to be a consensus that grandiose project management features for Trac should be implemented with a combination of plugins which provide useful functionality on their own. The following plan assumes that approach.
- Fork MasterTickets as TicketDep (or something) and add composed of/part of dependencies and means to create them. Plan for but do not yet implement starts with and ends with dependencies.
- Specify the interfaces necessary for a scheduling plugin to use dependencies, estimates, and time worked to determine project schedule.
- Consider adding a percentage available when scheduling resources.
- Specify the interfaces necessary for a Gantt chart to get data from tickets.
- Each task must have a name, duration, percent complete, and start or end. (The start or end comes from schedule calculations, not direct ticket data.)
- Access to dependencies between tickets is also needed so as to render the chart.
- Implement those interfaces on top of TimingAndEstimationPlugin.
Disclaimer
The bulk of this page was prepared by Chris Nelson who makes no claim to be certified project planner or anything of the sort. It is based on his understanding of project management after 25 years of software development. Other developers have also offered some hints and useful comments (according to their experience) in order to enhance this page, and get a better understanding of the features and requirements needed.
Contributors
- Olemis Lang
Attachments (10)
-
simple-gantt.PNG (7.0 KB) - added by 15 years ago.
A simple Gantt chart
-
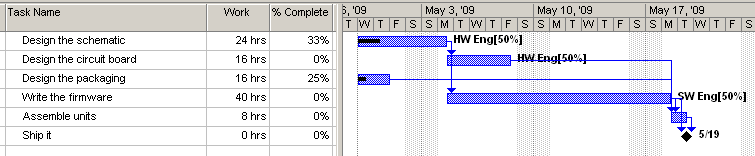
gantt-progress.PNG (7.9 KB) - added by 15 years ago.
Gantt chart with progress bars
-
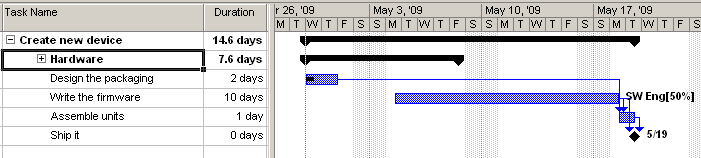
gantt-resource.PNG (11.0 KB) - added by 15 years ago.
Duration longer than work due to resources
-
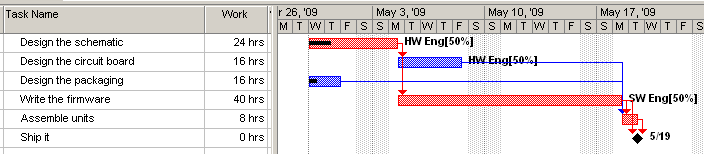
critical-path.PNG (9.9 KB) - added by 15 years ago.
Critical path
-
roll-up-1.PNG (12.7 KB) - added by 15 years ago.
Rolling up subtasks - 1
-
roll-up-2.PNG (9.6 KB) - added by 15 years ago.
Rolling up subtasks - 2
-
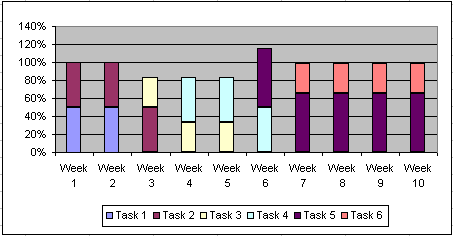
resource-utilization.PNG (5.9 KB) - added by 15 years ago.
Resource utilization chart
-
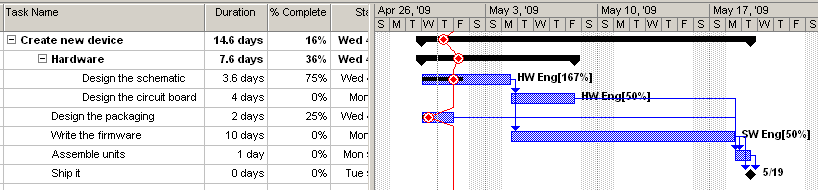
today.PNG (15.9 KB) - added by 15 years ago.
Gantt w/ "today" (progress) line
-
slack.PNG (15.4 KB) - added by 15 years ago.
Slack time illustration
-
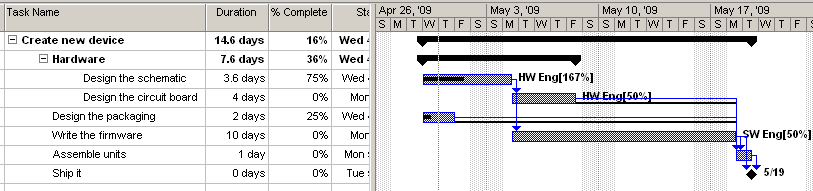
progress-line.PNG (15.9 KB) - added by 15 years ago.
Progress line
Download all attachments as: .zip