


| Version 66 (modified by , 15 years ago) (diff) |
|---|
Trac is strong in basic, individual and small-team task management but lacks features for heavy-duty project management a la Microsoft Project, Project Manager Workbench, etc. This page discusses those missing features and how they can best be realized.
Requirements and Definitions
Project management support software should help us answer a few basic questions:
- When will my project be done? (That is, what is the forecasted completion date.)
- How much Earned Value has the project achieved?
- How do incurred costs compare to Earned value (Cost Performance Factor).
- Am I on schedule? (That is, is the percent complete for the overall project where it should be at this time.)
- What tasks are on the critical path? (That is, what tasks have a positive or negative effect on the overall schedule if they are early or late.)
- How are my resources being utilized?
To answer these questions, the system must know about:
- Tasks to be done
- Dependencies between tasks
- Resources available to do tasks
- Assignment of resources to tasks
- Deadlines for task or project completion
Some of this information is part of the Trac core, some is provided by existing plugins, and some must be added to support project management. None of this information is antithetical to Trac's design and implementation.
Properties
A project management system must track properties of (information about) tasks, resources, and milestones.
Task Properties
Answering the questions listed above requires recording certain properties of a task.
- Original Work Estimate
- The amount of work believed to be needed to complete the task as of before the task was started. This is not, necessarily, the time it will take to complete the task (duration). The task may be unassigned (and will take forever to complete), may have a resource assigned only part-time (so it will take longer to complete than the amount of work indicates), or have multiple resources assigned (so it may take less time to complete than the amount of work indicates). Typically work will be expressed in hours of effort of a resource.
- Current Work Estimate
- The total time the task is expected to take, as of now. Like Original Work Estimate, but may be modified.
- Expended effort
- The amount of work expended against this task so far.
- Assigned resources
- The individuals who will work on this task.
- % Effort
- Per resource, the amount of the resource's time that will be spent on this task. If the resource is working on a 2-day task 50% of the time, we expect it to take 4 days.
- % Complete
- The amount of the task that has been done already. If there are 10 subtasks with 10 hours original work estimate and 6 are done, the task is 60% complete.
- Dependencies
- Other tasks that affect when this task can be started or finished.
- Task Hierarchy
- A "Work Breakdown Structure" is often used to give a hierarchical organization of all tasks on a project. Task 1.1.2 would have subtask 1.1.2.1 and 1.1.2.2. We propose to express the hierarchy but not force explicit numbering. We propose that each task have a single parent, which is the next level up in a WBS.
Dependencies
Task dependencies can be quite complex. Project management generally involves four types of dependencies between tasks or activities:
- Finish-to-Start (FS)
- Task B cannot start until task A finishes. This is the most common. Sometimes A is referred to as B's Predecessor. When building a house, the walls cannot be put up until the foundation is complete.
- Start-to-Start (SS)
- Task B cannot start until after task A starts (though they may finish independently). When building a house, interior painting cannot begin until the dry wall is started. (Each room can be painted as soon as its dry wall is up.)
- Finish-to-Finish (FF)
- Task B cannot finish until task A finishes (though they may begin independently). When building a house, inspections cannot be completed until construction has completed (though parts may be inspected before the whole job is done).
- Start-to-Finish (SF)
- Task B cannot finish until Task A starts. When building a house, the builder may begin getting interim payments during construction but payment will not be completed until the owner can start moving in.
In addition, managing the complexity of a large project requires breaking large tasks into smaller ones (or viewing groups of small tasks as larger aggregates). For example, interior painting might be broken down into paint the living room, paint the dining room, etc.
While useful, the FF and SF dependencies are somewhat more esoteric than the others and implementation may be deferred.
NOTE: The relationships are directional and inverting them is not straightforward. If A has a FS dependency on B, it is not true that B has an SF dependency on A.
Resource Properties
In general a project resource may be many things such as a person working on a task (a carpenter or a software developer) or a source of supplies needed for a task (cement or paint or computer systems).
A resource may have a name and typically has some availability. An employee may have responsibilities in two departments and only be available for certain work 50% of the time or a vendor may only be able to supply a certain amount of cement or paint or CPU cycles.
We don't seek to make Trac a completely general project management solution and will -- at least for now -- limit resources to people and assume they are available full time.
Milestone Properties
The essential property of a milestone is its date. Trac tickets which are part of a milestone are implicitly due by the milestone date. In general project management, milestones have FS dependency with some some tasks. Together with dependencies between tasks, this dictates when tasks must be done to keep a project on schedule.
Task Scheduling
There are two fundamental ways to approach scheduling. One is to assume that all tasks are small and to divide total estimates by resource rate. Then, one compares earned value to cost, computes CPF, and computes an estimated end time. This is far simpler, but fails to capture tasks that only some people can work on and other complexities. The other is to create an actual plan that shows when each resource will work on tasks.
The basic answer to "When will my project be done?" is generally displayed in a Gantt chart which shows tasks, their dependencies, their duration (scaled by resource availability), and milestones. Two threads on the Trac Users mailing list, suggest that a Gantt chart is a fundamental requirement for project management but scheduling tasks is even more fundamental and a necessary precondition for producing a Gantt chart.
Consider a grossly-simplified project to design a new electronic device. This project might have the following tickets:
| ID | Summary | Milestone |
| 1 | Design the Schematic | New device |
| 2 | Design the Motherboard | New device |
| 3 | Design the Daughter board | New device |
| 4 | Design the packaging | New device |
| 5 | Write firmware | New device |
| 6 | Assemble units | New device |
With this simple task list -- supported by core Trac tickets and milestones -- we'll know when we are done because all the tickets are closed but we have no way to project when that will be. If all the tasks could be done concurrently, the project length is the length of the longest task. And since Trac assigns a date to the milestone, we can sort of work backwards from that to determine when work needs to start for the milestone to be met. However, core Trac has no way to record the time that a task should take. We need a field to hold Work.
| ID | Summary | Work |
| 1 | Design the Schematic | 24h |
| 2 | Design the Motherboard | 8h |
| 3 | Design the Daughter board | 8h |
| 4 | Design the packaging | 16h |
| 5 | Write firmware | 40h |
| 6 | Assemble units | 8h |
From here we can guess that the shortest the project could be is one week. However, we know we cannot begin circuit board layout without a schematic. We need a field to hold Predecessors.
| ID | Summary | Estimate | Predecessors |
| 1 | Design the Schematic | 24h | |
| 2 | Design the Motherboard | 8h | 1 |
| 3 | Design the Daughter board | 8h | 1 |
| 4 | Design the packaging | 16h | |
| 5 | Write firmware | 40h | 1 |
| 6 | Assemble units | 8h | 2,3,4,5 |
For such a short task list we can manually inspect and see that assembly (8h) follows firmware (40h) follows schematic (24h) and the shortest project time is 72 hours (9 man-days) and we can take nine days from the milestone date to know when we have to start work to finish on time. However, a project of any complexity may have many, many more tasks and manual inspection is impractical.
We can begin to do more effective project management if we have a task scheduler than can work backwards from the milestone, consider work and dependencies, and calculate task start and end dates and project start date.
If the milestone for this work is May 11, the schedule might look like the following.
| ID | Summary | Work | Predecessors | Due | Start |
| 1 | Design the Schematic | 24h | May 5, 2009 | May 3, 2009 | |
| 2 | Design the Motherboard | 8h | 1 | May 10, 2009 | May 10, 2009 |
| 3 | Design the Daughter board | 8h | 1 | May 10, 2009 | May 10, 2009 |
| 4 | Design the packaging | 16h | May 10, 2009 | May 9, 2009 | |
| 5 | Write firmware | 40h | 1 | May 10, 2009 | May 6, 2009 |
| 6 | Assemble units | 8h | 2,3,4,5 | May 11, 2009 | May 11, 2009 |
This is computed as follows:
- Assemble units is the last step and is due when the milestone is scheduled
- Firmware, packaging design, and the circuit board all must be done before assembly or 1 day (the length of the assembly task) before the milestone
- Schematic is due the length of the circuit board task before the circuit board's end
To finish on time, the project must start on May 3, the earliest start time for any task.
However, the preceding schedule assumes that the motherboard and daughter board are independent tasks. If there is only one board designer, only one board at a time can be worked on. If we assign the same resource to the board designs, either one must be done before the other can begin (even in the absence of an FS dependency) or the time for both must be extended and the resource spread between them concurrently.
With 100% applied to each task, the motherboard and daughter board are worked on serially.
| ID | Summary | Work | Predecessors | Resource | Due | Start |
| 1 | Design the Schematic | 24h | May 5, 2009 | May 3, 2009 | ||
| 2 | Design the Motherboard | 8h | 1 | Monty | May 9, 2009 | May 9, 2009 |
| 3 | Design the Daughter board | 8h | 1 | Monty | May 10, 2009 | May 10, 2009 |
| 4 | Design the packaging | 16h | May 10, 2009 | May 9, 2009 | ||
| 5 | Write firmware | 40h | 1 | May 10, 2009 | May 6, 2009 | |
| 6 | Assemble units | 8h | 2,3,4,5 | May 11, 2009 | May 11, 2009 | |
With 50% applied to each task, the board designs are worked on in parallel but take twice as long.
| ID | Summary | Work | Predecessors | Resource | Due | Start |
| 1 | Design the Schematic | 24h | May 5, 2009 | May 3, 2009 | ||
| 2 | Design the Motherboard | 8h | 1 | Monty (50%) | May 9, 2009 | May 10, 2009 |
| 3 | Design the Daughter board | 8h | 1 | Monty (50%) | May 9, 2009 | May 10, 2009 |
| 4 | Design the packaging | 16h | May 10, 2009 | May 9, 2009 | ||
| 5 | Write firmware | 40h | 1 | May 10, 2009 | May 6, 2009 | |
| 6 | Assemble units | 8h | 2,3,4,5 | May 11, 2009 | May 11, 2009 | |
Calendar
The schedule above isn't accurate unless we have a 7-day work week. If we assume that the work week is Monday to Friday with Saturday and Sunday off, firmware has to finish Friday, May 8 and schematic has to finish Friday, May 1 so the project must begin April 29. Applying calendar information, our task list looks like the following.
| ID | Summary | Work | Predecessors | Resource | Due | Start |
| 1 | Design the Schematic | 24h | May 1, 2009 | April 29, 2009 | ||
| 2 | Design the Motherboard | 8h | 1 | Monty | May 7, 2009 | May 7, 2009 |
| 3 | Design the Daughter board | 8h | 1 | Monty | May 8, 2009 | May 8, 2009 |
| 4 | Design the packaging | 16h | May 8, 2009 | May 7, 2009 | ||
| 5 | Write firmware | 40h | 1 | May 8, 2009 | May 4, 2009 | |
| 6 | Assemble units | 8h | 2,3,4,5 | May 11, 2009 | May 11, 2009 | |
Gantt Charts
Dependency and Duration
Once we have a task scheduler, we can simplify presentation of task scheduling with a very basic Gantt that showed just tasks and their dependencies and the resultant schedule.

Disregarding any resource constraints, this chart shows
- circuit board design and firmware development follow schematic design
- package design can proceed independently
- assembly can't be done until the circuit boards and packaging are ready
- the product can't ship until it's assembled and has firmware.
- the overall project will take 9 calendar days
This requires only that the ticket have some information about estimated effort or duration of the task and simple FS task dependency.
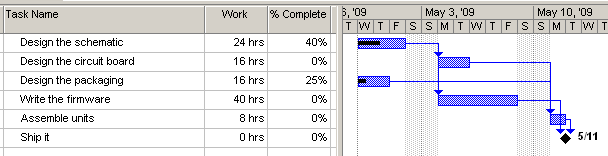
Progress
If we also track work on tasks, we can monitor project progress at a glance.

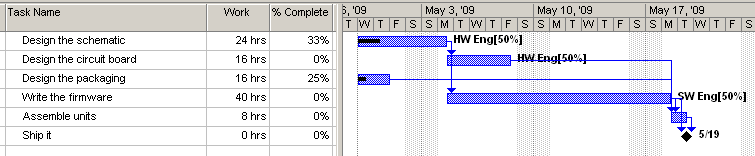
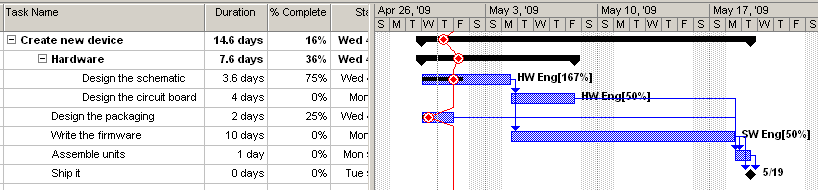
Resource Allocation
When a resource is not available 100% of the time, tasks take longer than the work suggests. By assigning effort to resources, we can chart this time dialation.

When the hardware and software engineers are only available half time, the project gets delayed.
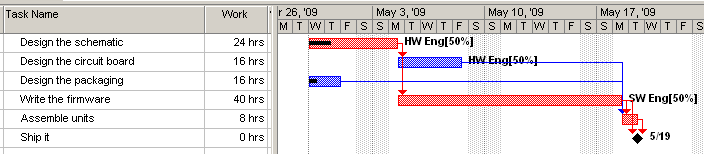
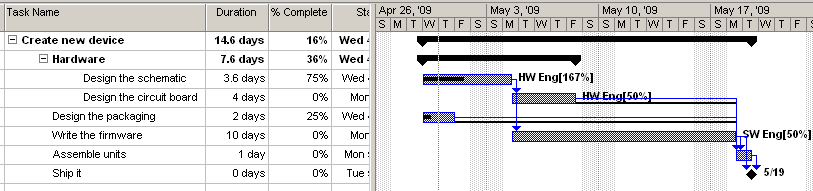
Critical Path
Some tasks affect project schedule and some do not. The tasks which affect the schedule are on the critical path.

Packaging design and circuit board layout are so short -- relative to other activities -- that speeding them up doesn't really help the project. But if we could shorten schematic design or firmware, every day we take out of one of those activities we also take out of the project schedule.
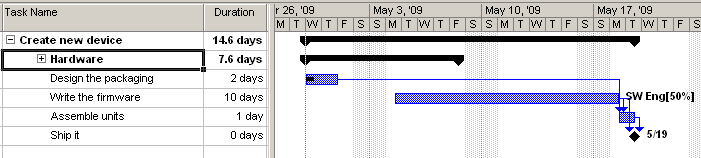
Sub-tasks
To manage the complexity of the chart, we can break tasks down into sub-tasks and show various levels of detail.


Progress Line
A Gantt chart often includes a "today" line to show where a project stands.

Bumps to the left indicate tasks that are behind schedule.
Slack Time
A Gantt chart may also show slack time for tasks, how much they can slip before affecting the overall schedule.

The black bars extending from the bottom of circuit board and packaging design indicate how much those tasks can slip without affecting deliverable.
Should talk about lag here
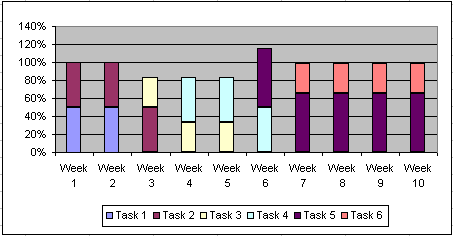
Resource Utilization
There are several views of resource utilization which may be helpful:
- utilization over time (80% loaded this week, 110% next week, 70% the week after, etc.)
- allocation at a time (10% on task 1, 20% on task 2, 50% on task 3, etc.)
Both views may be combined in a sequence of stacked bar graphs. At T1, a resource is 80% utilized with 20% each on four tasks, at T2, one task is complete and the resource is 60% utilized with 20% on each of the remaining three tasks, etc.

Earned Value
To compute earned value, we need unchanged original estimates, and probably also some way to estimate remaining time.
Resource Description and Allocation
We need a proposal for how to describe available resources within trac.
If we use tickets to express tasks, then one could assume that a ticket will be worked on by the ticket's owner. It might then be necessary to allow tickets to have multiple owners. Or, we might want to have a way to have a list of (resource,hours) pairs independent of the owner.
Related Work
Trac Plugins
Trac has three Gantt chart plugins:
- FlashGantt
- seems complex and stale.
- GanttChart
- is a very simple Gantt chart implemented in a formatted text region. It is manually edited, not data-driven.
- TracGantt
- has potential but has some funky fields (e.g., Due to Assign) that don't seem to be appropriate to what we want to do with a Gantt chart.
Pale Purple's Virtual Planner is an alternative visualization tool.
MasterTicketsPlugin supports FS dependency (but calls it blocks and blocked by).
The SubTickets page talks about adding composition type dependency. Can this be done in a plugin like MasterTickets or must it be in the core?
TimingAndEstimationPlugin and TracHoursPlugin add estimated and actual hours fields to tickets. There is some disagreement about whether the estimate is the remaining time (so total estimated time is actual + estimate) or total time (so remaining time is estimate - actual). A Gantt chart typically wants estimate and percent complete. It is possible to extract this from either recording convention and we should likely allow either convention via a configurable interface.
TeamCalendarPlugin keeps track of user availability.
A fact of life is that Microsoft products like Exchange and Outlook are present in many environments. It would be nice if we could get availability information from Exchange to feed a project calendar. Just reading from the group calendar would probably be enough. That way users would only have to put in their vacations, etc. in one place.
Other work
There is a Google Gadget Gantt chart which might be leveraged for the visualizations once the data is made available (e.g., using TracGViz plugin). That widget is developed and maintained by a company (i.e., ViewPath). Besides users need access to the internet and their projects environments have to be available too so that the iGoogle container be able to retrieve the data to display in the chart. All this means that local deployments (intranets, ...) are not possible.
Planner is an open source project management program.
GNOME Office once included MrProject (which may be another version of Planner). The news of MrProject's death may be exaggerated; GNOME Live! lists a 0.14.4 release in April 2009.
dotProject is an open-source, web-based project management system. A quick review suggests its task management isn't as good as Trac. It has a Gantt chart but wikipedia notes "as of version 2.0 the task dependencies feature is not complete". It has a troubled history but was forked last year as Web2Project.
I reviewed 15 Useful Project Management Tools. It mentions Trac. None of the tools obviously have scheduling in them. Jira sounded promising but doesn't seem to have scheduling. Their chart examples don't include a Gantt. Basecamp is popular and promising:
Basecamp works
For years project management software was about charts, graphs, and stats. And you know what? It didn’t work. Pictures and numbers don’t get projects done. Basecamp tackles project management from an entirely different angle: A focus on communication and collaboration. Basecamp brings people together.
But it is also commercial (which doesn't really help the Trac community). The description above makes it sound like we shouldn't expect a Gantt chart in Basecamp. ;-) I don't see automatic scheduling. They have a nice feature where you can subscribe to milestone updates via iCalendar.
Also:
- Open Workbench is a Microsoft Windows-based application not suitable for integration with a web-based tool like Trac.
- OpenProj also appears to be a desktop application. However, their views page may guide development of PM output for Trac.
- GanttProject's website isn't very informative but it appears to be a desktop application.
Microsoft Project Task Properties
Microsoft Project goes far beyond what is likely to be put into a Trac-based project management solution but it may be helfpul to consider what task properties MSProject records and what their analogs may be in Trac tickets.
The Microsoft Project Task Information property sheet includes:
- General
- Name
- Duration
- Estimated (Boolean)
- Percent complete
- Priority
- Start date
- Finish date
- Predecessors - A list of related tasks and their relationships
- ID
- Task Name
- Type (FS, SS, etc.)
- Lag (delay between tasks, overlap between tasks or lead if negative)
- Resources - A list of resources
- Resource Name
- Units (% Effort for workers)
- Advanced
- Constraint
- Deadline (a date or N/A)
- Constraint (ASAP, ALAP, Start no earlier than, etc.)
- Constraint date
- Task Type (Fixed Units, Fixed Work, Fixed Duration)
- Calendar (Standard, 24hr, Night Shift)
- WBS code (outline number from Work Breakdown Structure such as 1.3 for the third subtask of task 1)
- Earned value method (% Complete or Physical % Complete)
- Constraint
- Notes (Like ticket comments, only worse)
- Custom Fields
However, this doesn't seem to be all the data Project records for a task. If you add a column to the WBS in the Gantt chart, there are many more options. The most interesting is Work which is the amount of work required to complete a task. Only when a resource is assigned 100% are Work and Duration the same. We'd like to be specify the work required for a task and let the system calculate its duration based on available resources.
Roadmap
There seems to be a consensus that grandiose project management features for Trac should be implemented with a combination of plugins which provide useful functionality on their own. The following plan assumes that approach.
- Tasks will be represented as tickets.
- We need a way to express WBS relationships, assuming MasterTickets will be used to express dependencies. If we need more than FS dependencies, we will need to extend MasterTickets to express dependency type.
- TimingAndEstimation can be the basis of recording estimates. The plugin should be extended to support original and revised estimates, and to store default estimates in the database (rather than have rules to use the default value for tickets with tiny estimates).
- We need a new resource plugin to allow describing resources and their availability. This should support notions of normal work hours, holidays, etc.
- Basic scheduling can be provided based on core Trac tickets, MasterTickets, and TimingAndEstimation. (This discounts resource conflicts and availability.) A new Scheduling plugin can build on these plugins (or an interface that hides them), add Start and Finish dates to tickets, and schedule going back from a milestone.
- Once a scheduler exists, a simple Gantt chart can be implemented to show dependencies and schedule. (This might even be a revision or refinement of an existing Gantt.)
- Additional dependency types can be added, perhaps by enhancing or forking MasterTickets.
- Additional Gantt display options (e.g., critical path) can be added independent of additional dependency types.
- The scheduler can be enhanced to take into account resource conflicts.
Design
(I'm a little out of my depth here, designing for Trac internals I don't understand. Hopefully, more experienced Trac developers will guide me. -- Chris)
To add better project management to Trac in a modular fashion requires defining the interfaces that project management implementations rely on. We'll name these with a common prefix "IProject". The 'I' is for "Interface", a common convention in Trac development. The "Project" might be "PM" or "ProjMgr" or something. This is certainly open to discussion.
IProjectTask
gdt: why isn't this just tickets? We need a way to indicate which resources can work on which tasks.
IProjectCalendar
The essential feature of a project calendar is that it knows when work is not done (weekends and holidays) so that task duration can account for that down time.
A slightly more sophisticated implementation would track individual resource availability so that the schedule can account for vacations and such.
IProjectResource
Describes resource availability. May need calendar options for individuals. Some may want progress rates and costs, and some may not - this is surely controversial.
IProjectSchedule
Random algorithm notes.
- As Late As Possible (ALAP) with only FS dependency is an easy scheduling algorithm. A task without successors is due on it's milestone date and things back up from there. However, it is sometimes helpful to use ASAP, even for single tasks. For example, if a software development task is poorly understood so its estimate might be wildly wrong, that task should be tackled early in the project so that deviation from estimate is known early and there is more time to adjust for it. Also, it's often desirable to handle bugs before new features so tasks might get ALAP and bugs ASAP within the same project.
- There are three constraints that influence a task's scheduling:
- The date of the task's milestone
- Dependency on other tasks
- Resource sharing
- For ALAP with FS and 100% resource application (effort)
- Task A's finish date is the milestone date if it has no successors
- Task A's finish date is Task B's start date if B has an FS dependency on A (A -> B)
- Resolve resource conflict:
- Task A should be before B if A has successors and B does not
- Task A should be before B if A is higher priority
- Task A should be before B if A has more risk
- With the above rules for putting A before B, does scheduling become a sorting operation that just needs a comparison function which implements those rules? Intuitively, an O(n2) sort like bubble sort would work but something like a merge sort might not because tasks in the partitions might depend on one another. Perhaps partitioning can be done to eliminate dependencies.
...more here...
Disclaimer
The bulk of this page was prepared by Chris Nelson who makes no claim to be certified project planner or anything of the sort. It is based on his understanding of project management after 25 years of software development. Other developers have also offered some hints and useful comments (according to their experience) in order to enhance this page, and get a better understanding of the features and requirements needed.
Contributors
- Olemis Lang
- Greg Troxel
Old design notes
(I'm reworking these into a better flow for the whole document.)
Component Data
Each Gantt chart component or feature requires data to support it. For Trac-based project management, this data is often in addition to the core ticket data.
In general, we might expect to have multiple resources assigned to a task but if we use a Trac ticket as the basis for a task, we have only a single resource, the ticket owner.
Core Fields
Core ticket fields include relevant to project management include:
- owner (who is working on it)
- milestone (what milestone this ticket is part of)
- status (new, assigned, ..., closed)
- summary (short description)
Core milestone fields relevant to project management include:
- name
- due (date and time)
- completed (treated as a Boolean: open or closed)
Additional Data
For project management, we must have the following additional information about a task/ticket:
- estimate (expected work required to complete task)
- percent complete
- dependencies
- percent effort
NOTE: While Gantt charts typically show percent complete, this can be computed from time remaining vs. total estimate or time worked vs. total estimate. We will not, necessarily, store percent complete. It is intuitive for display and analysis but difficult for data entry.
A Gantt plugin for Trac should analyze ticket dependencies and produce an interactive, explorable Gantt chart showing task progress and project status.
By "project", I mean a set of related milestones. Perhaps a software project has a Design Phase, an Alpha Release, a Beta Release, and a General Release. Each phase would have a milestone with a target date and tickets to complete the work for that phase. There must be a way to specify which milestones to include either listing explicitly or by giving a pattern or substring filter.
What do we need in the back end ?
The chart should be able to show all tickets (though that may be a very complex chart) or alternately all those tickets matched by a (query | report) or any other ticket group provider.
To effectively display project progress, tickets must have estimated and actual times as in the TimingAndEstimation plugin.
It is also desirable to have loop detection to error-proof the tool used to create dependencies.
It would be nice to be able to choose an As Late As Possible or As Soon As Possible algorithm for laying out tasks.
What do we need in the user interface ?
A "chart these" button on a report page would be very nice.
Tasks in the chart should be links to the tickets they represent (preferentially opened in a separate tab or window).
Milestones should be displayed in the chart as well.
The chart should support interactively "folding" groups of tasks to hide detail.
Zooming in order to see the WBS in more detail.
Panning or scrolling in order to display the schedule at a different time.
Each task's bar in the chart should show % complete.
The chart should have a Today line.
An accompanying report or tool should aid in resource leveling by (at least) showing overcommitted resources.
Visual indications about delays, task completion and other significant events.
It would be nice to be able to create task dependencies graphically using the Gantt chart as a GUI or to change a milestone date by dragging it along the chart.
Design guidelines
In order to agree about how to implement this functionality, the very first step should be to describe the possible architectures (i.e., how the different components are going to interact with each other since the moment the request is sent by the client until the Gantt chart is rendered by the browser) that will be considered.
Components
In order to add flexibility to the final solution, the MVC pattern should be considered during its development. Hence the following components need to be implemented in order to add Gantt charts to Trac.
The Model
It provides the data in the Gantt chart and is not just a single element but a set of components like the following :
- The ticket models, which provide data about the issues found in the project environment
- Trac query mechanism which provides a way to select (filter) the tickets being shown.
- Other plugins used to track ticket dependencies
- Other plugins used to track task/subtask relationships
- Other plugins used to estimate the time needed to finish the given tasks
- Maybe one (a few) component(s) whose role is to provide the functionality specific to Gantt charts, thus acting as a central access point and a mediator so as to put all the other components together.
The View
It should be a JavaScript component (is this possible ?) responsible for rendering the data provided by the model. Besides it might support other dynamic features
The Controller
¿What do we need this for?
Implications
The aforementioned separation should allow the replacement of any of the components involved. Hence the following modifications should be made easily (the list being intentionally incomplete) :
- Replace the JS-based view by another made with Flash.
- Use a custom, or specific estimation strategy.
Attachments (10)
-
simple-gantt.PNG (7.0 KB) - added by 15 years ago.
A simple Gantt chart
-
gantt-progress.PNG (7.9 KB) - added by 15 years ago.
Gantt chart with progress bars
-
gantt-resource.PNG (11.0 KB) - added by 15 years ago.
Duration longer than work due to resources
-
critical-path.PNG (9.9 KB) - added by 15 years ago.
Critical path
-
roll-up-1.PNG (12.7 KB) - added by 15 years ago.
Rolling up subtasks - 1
-
roll-up-2.PNG (9.6 KB) - added by 15 years ago.
Rolling up subtasks - 2
-
resource-utilization.PNG (5.9 KB) - added by 15 years ago.
Resource utilization chart
-
today.PNG (15.9 KB) - added by 15 years ago.
Gantt w/ "today" (progress) line
-
slack.PNG (15.4 KB) - added by 15 years ago.
Slack time illustration
-
progress-line.PNG (15.9 KB) - added by 15 years ago.
Progress line
Download all attachments as: .zip