


| Version 1 (modified by , 15 years ago) (diff) |
|---|
Trac is strong in basic, individual and small-team task management but lacks features for heavy-duty project management a la Microsoft Project, Project Manager Workbench, etc. This page discusses those missing features and how they can best be realized.
Gantt Charts
As discussed in two threads on the Trac Users mailing list, a fundamental requirement for project management is a Gantt chart.
Trac has three Gantt chart plugins:
FlashGantt seems complex and stale.
GanttChart is a very simple Gantt chart implemented in a formatted text region. It is manually edited, not data-driven.
TracGantt has potential but has some funky fields (e.g., Due to Assign) that don't seem to be appropriate to what we want to do with a Gantt chart.
Project Management Requirements
Attachments (10)
-
simple-gantt.PNG (7.0 KB) - added by 15 years ago.
A simple Gantt chart
-
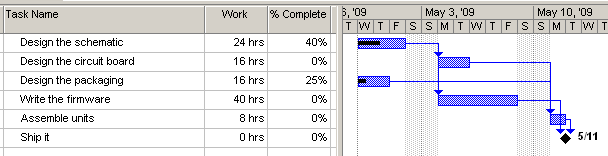
gantt-progress.PNG (7.9 KB) - added by 15 years ago.
Gantt chart with progress bars
-
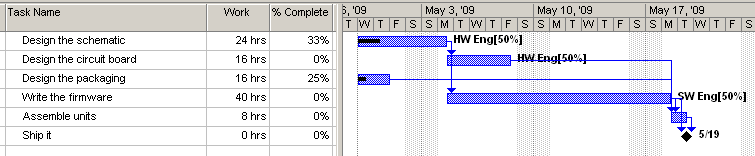
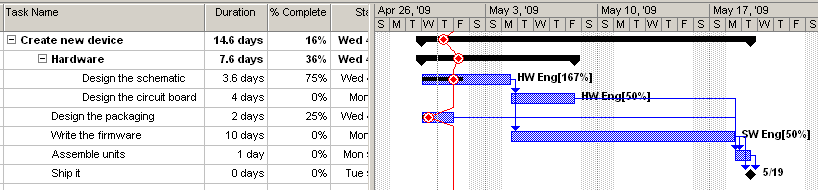
gantt-resource.PNG (11.0 KB) - added by 15 years ago.
Duration longer than work due to resources
-
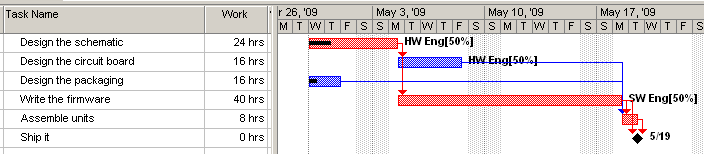
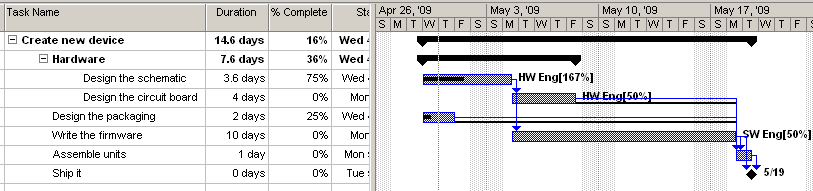
critical-path.PNG (9.9 KB) - added by 15 years ago.
Critical path
-
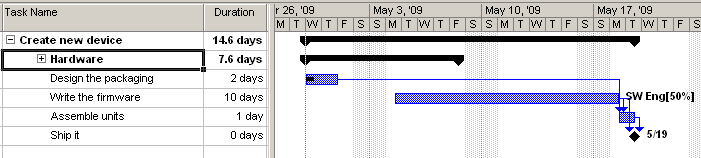
roll-up-1.PNG (12.7 KB) - added by 15 years ago.
Rolling up subtasks - 1
-
roll-up-2.PNG (9.6 KB) - added by 15 years ago.
Rolling up subtasks - 2
-
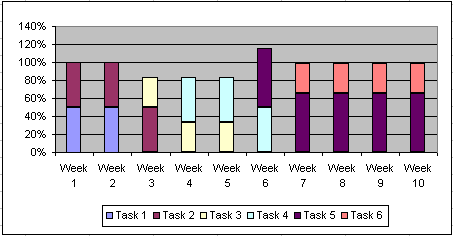
resource-utilization.PNG (5.9 KB) - added by 15 years ago.
Resource utilization chart
-
today.PNG (15.9 KB) - added by 15 years ago.
Gantt w/ "today" (progress) line
-
slack.PNG (15.4 KB) - added by 15 years ago.
Slack time illustration
-
progress-line.PNG (15.9 KB) - added by 15 years ago.
Progress line
Download all attachments as: .zip