


| Version 4 (modified by , 15 years ago) (diff) |
|---|
View the trac.log file via the web frontend
Description
This plugin allows you to view your trac.log logfile without shell access, just via the Web-UI Admin interface. You can select to only display messages from a specified log level (e.g. only warnings), optionally including higher levels. So if you select "Debug" and all higher levels, this means to display the entire log.
Be careful with large log files ;)
Bugs/Feature Requests
Existing bugs and feature requests for LogViewerPlugin are here.
If you have any issues, create a new ticket.
Download
Download the zipped source from [download:logviewerplugin here].
Source
You can check out LogViewerPlugin from here using Subversion, or browse the source with Trac.
Installation
The easiest way to install this plugin is:
easy_install http://trac-hacks.org/svn/logviewerplugin/0.11/trunk
You can also checkout the code from the repository, or download and unpack the zipped source (see above) - and then run either easy_install or python setup.py from where the setup.py file resides.
Moreover, you will need to enable the plugin for your trac environment(s):
[components]
logviewer.* = enabled
There's no more configuration required.
Usage
You find the Log Viewer on the Admin page in the General section (see below). Having this page called, you select the log level you wish to see the entries for, using the drop-down. Optionally, you may chose to display all "higher priority" as well (where "higher" means the entries on top of the one you selected).
Optionally, you now can further restrict the amount of lines displayed: The Tail input works similar to the tail -f command, only showing the last N lines. If you input nothing here, this restriction is skipped - but if you do, the following search will be limited to these lines. In the Search input box you can enter a term which must be found in a line to be displayed. You can also use regular expressions here, in which case you must check the corresponding button. If you additionally check the "not" button, that search will be inverted - i.e. only lines not containing/matching your search term will be shown.
Oh, btw: hovering your mouse over the input areas will give you a short tooltip, in case you forgot these meanings ;)
Once you made your selections, push the button - and the matching lines from the trac.log will be displayed.
Example
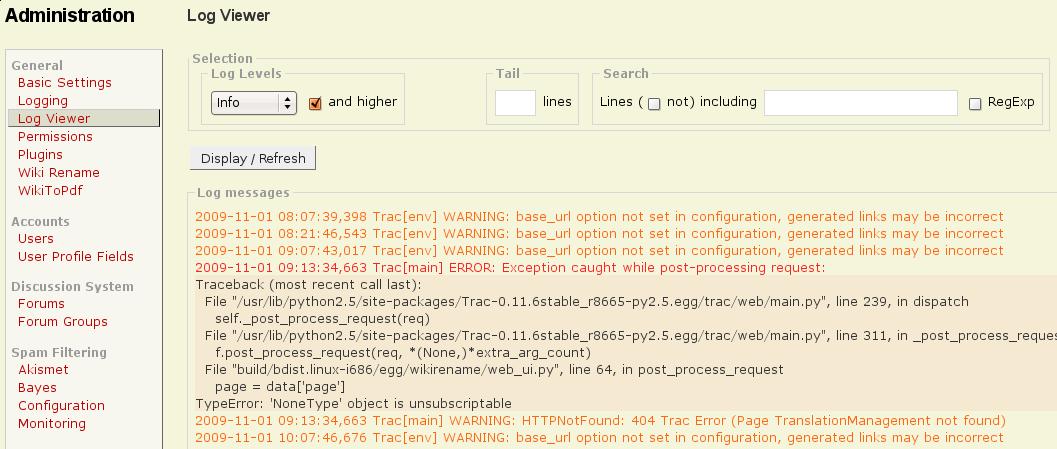
Hell, what example? OK: Here is what it may look like, having selected "Warnings and above":

As you can see, the log lines are quite colorful: different colors have been applied to different log levels. If you don't like my choice of colors here, you can easily apply your own style sheets. All elements can be identified without problems: the different log levels use classes, and even the other elements of the GUI use classes and ids.
User Comments
- Your feedback here, please :-)
Recent Changes
- 17738 by rjollos on 2020-05-12 06:57:04
-
TracLogViewer 0.4dev: Translate panel name
Refs #13816.
- 17737 by rjollos on 2020-05-12 06:17:58
-
TracLogViewer 0.4dev: Fix missing import from r17736
Refs #13816.
- 17736 by rjollos on 2020-05-12 05:06:57
-
TracLogViewer 0.4dev: Refactor
Start adapting to Trac 1.4 API.
Refs #13816.
(more)
Author/Contributors
Author: izzy
Contributors:
Attachments (3)
-
logviewer.jpg (86.0 KB) - added by 15 years ago.
Viewing selected log entries
-
LogViewerPlugin-0.1-py2.5.egg (8.6 KB) - added by 15 years ago.
LogViewerPlugin v0.1
-
LogViewerPlugin-0.2-py2.5.egg (10.9 KB) - added by 14 years ago.
LogViewerPlugin v0.2
Download all attachments as: .zip