


| Version 2 (modified by , 15 years ago) (diff) |
|---|
TicketChartsMacro - display ticket statistics charts
Description
Make various types of charts regarding the number of tickets using Open Flash Charts. Chart types:
- Pie charts.
- Bar charts.
- Stacked bar charts.
The charts are created by the parameters that you give to the macro. See the examples below.
All charts are clickable (see requirements) and will link to the query page of the graph.
Bugs/Feature Requests
Existing bugs and feature requests for TicketChartsMacro are here.
If you have any issues, create a new ticket.
Download
Download the zipped source from [download:ticketchartsmacro here].
Source
You can check out TicketChartsMacro from here using Subversion, or browse the source with Trac.
Requirements
- Open Flash Charts installed on your server - preferably OFCDZ to make the charts clickable.
- Advanced Argument Parser for Trac Macros (AdvParseArgsPlugin).
- Tested only on Trac 0.11.3.
- Tested only on Apache configuration, but with proper configuration (see configuration section) this should work with any http server (including tracd).
Installation
- Download the source.
- Copy the file TicketCharts.py to your project's plugins directory or to the global plugins directory, which is usually in:
/usr/share/trac/plugins
- Enable TicketCharts plugin via the WebAdmin interface or by adding the following lines to the [components] section of trac.ini:
ticketcharts.* = enabled
- Install Open Flash Charts 2 and its version 2 python bindings (everything can be downloaded from Open Flash Charts).
Configuration
- The following configuration should appear in trac.ini:
[ticket-charts]
height = 300
width = 500
js_dir = /js
json_dir = /js/json
ofc_file = /OFCDZ.swf
- If this does not appear, default values will be used.
- js_dir, jsor_dir and ofc_file are the location on the http server of the Open Flash Charts files.
- As you can see, the default ofc_file value is OFCDZ.swf, which is another implementation of Open Flash Charts, that make the bar charts clickable. You can download it from OFCDZ.
Example
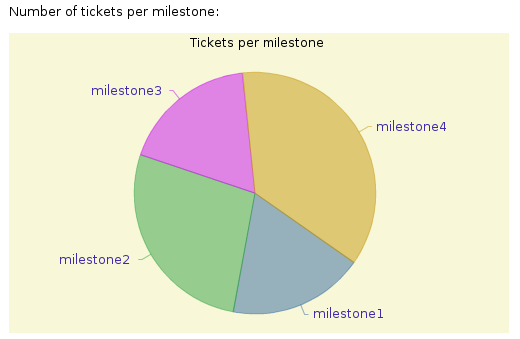
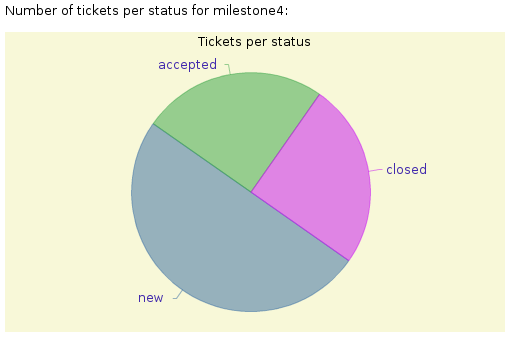
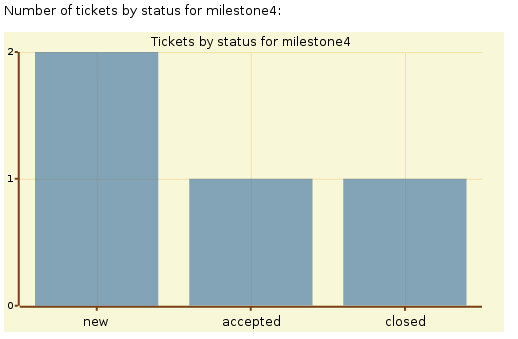
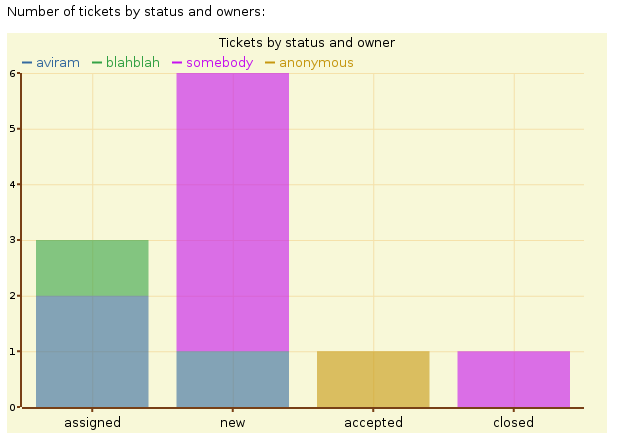
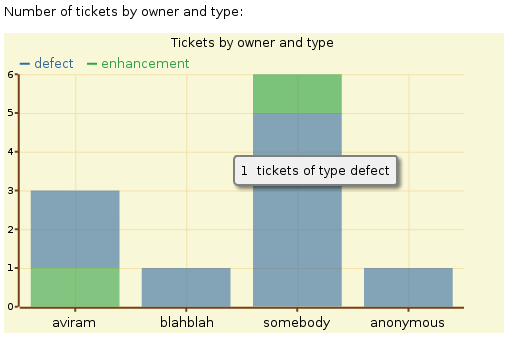
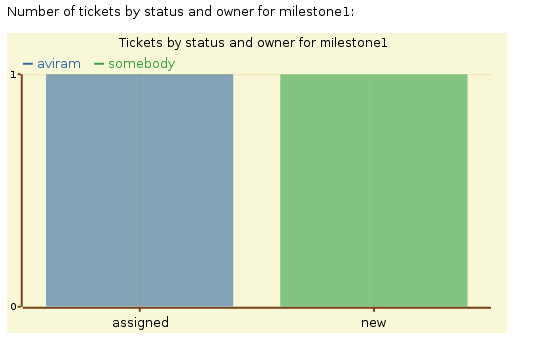
Number of tickets per milestone:
[[TicketChart(type = pie, factor = milestone)]]

Number of tickets per status for milestone4:
[[TicketChart(type = pie, factor = status, query = milestone="milestone4")]]

Number of tickets by status and owners:
[[TicketChart(type = stacked_bars, key = owner, x_axis = status, height = 400, width = 600)]]

Number of tickets by status and owner for milestone1:
[[TicketChart(type = stacked_bars, key = owner, x_axis = status, query = milestone="milestone1", title = Tickets by status and owner for milestone1)]]

Number of tickets by owner and type:
[[TicketChart(type = stacked_bars, key = type, x_axis = owner)]]

Number of tickets by status for milestone4:
[[TicketChart(type = bars, x_axis = status, query = milestone="milestone4", title = Tickets by status for milestone4)]]
Recent Changes
- 13335 by jun66j5 on 2013-07-17 16:26:41
-
refs #6904: fixed
UnicodeDecodeError,_get_random_stringgenerates a 8-bit string if non en-US locale
- 13250 by rjollos on 2013-05-27 14:50:34
-
Refs #6904, #11072: Refactoring and improved backward compatibility for changes in [13247] and [13248], suggested by Jun Omae (jun66j5).
- 13248 by rjollos on 2013-05-27 12:12:16
-
Refs #11072: Avoid values of 'None' in query string for "clickable link" when value should be an empty string.
(more)
Author/Contributors
Author: aviram
Contributors:
Attachments (6)
- pie_by_milestone.png (15.9 KB) - added by 15 years ago.
- pie_by_status.png (13.0 KB) - added by 15 years ago.
- bars_for_milestone4.png (7.2 KB) - added by 15 years ago.
- stacked_bars.png (12.2 KB) - added by 15 years ago.
- stacked_bars_2.png (12.5 KB) - added by 15 years ago.
- stacked_bars_for_milestone1.png (8.9 KB) - added by 15 years ago.
Download all attachments as: .zip