


Contents
Display ticket statistics charts
Notice: This plugin is deprecated since depends on Flash, support for which is being removed from all major browsers.
Description
This macro allows the creation of charts on ticket statistics. It uses Open Flash Charts, which itself is no longer maintained and LGPLv2 licensed.
The chart types supported are:
- Pie charts.
- Bar charts.
- Stacked bar charts.
The charts are configured by the parameters that you pass to the macro. See the examples below.
All charts are clickable and will link to the ticket query page of the graph.
See also TracTicketStatsPlugin, TracMetrixPlugin.
Bugs/Feature Requests
Existing bugs and feature requests for TicketChartsMacro are here.
If you have any issues, create a new ticket.
| defect |
19 / 19 |
|
|---|---|---|
| enhancement |
5 / 5 |
|
| task |
3 / 3 |
Download
Download the zipped source from here.
Source
You can check out TicketChartsMacro from here using Subversion, or browse the source with Trac.
Installation
- Download the source.
- Copy the file TicketCharts.py to your project's plugins directory or to the global plugins directory, which is usually
/usr/share/trac/plugins. - Enable TicketCharts plugin via the WebAdmin interface or by adding the following lines to the [components] section of your
trac.inifile:[components] ticketcharts.* = enabled
Configuration
The following configuration can appear in trac.ini (default values are shown):
[ticket-charts]
height = 300
width = 500
The arguments are:
- Arguments for all types of graphs:
- type - The type of the graph. Can be
pie,barsorstacked_bars. - height, width - The height and width of the graph, in pixels. Percentages will not work. If not specified, the values from trac.ini are taken, and if those aren't specified, then other default values are used.
- title - Text that will be displayed on the top of the chart.
- query - A Trac Query. All the stats will be taken from this query. Examples:
query = milestone=my_milestone&owner=aviram|danny
- factor - The name of the field by which the stats will be formed.
- type - The type of the graph. Can be
- Arguments for bar graphs:
- x_axis - The name of the field by which the stats will be formed (The X Axis values).
- Arguments for stacked bars graphs:
- x_axis - The name of the field by which the stats will be formed (The X Axis values).
- key - The name of the field by which the chart's columns are divided.
Examples with Snapshots
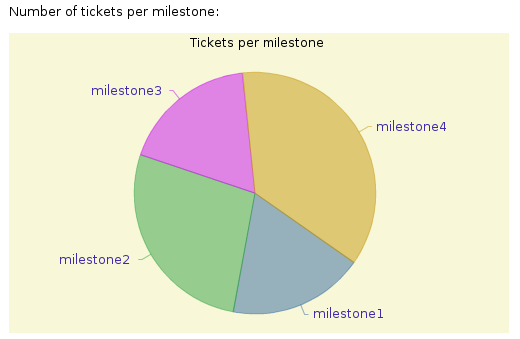
Number of tickets per milestone:
[[TicketChart(type = pie, factor = milestone)]]

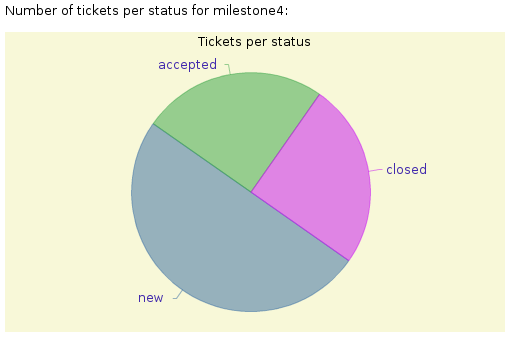
Number of tickets per status for milestone4:
[[TicketChart(type = pie, factor = status, query = milestone=milestone4)]]

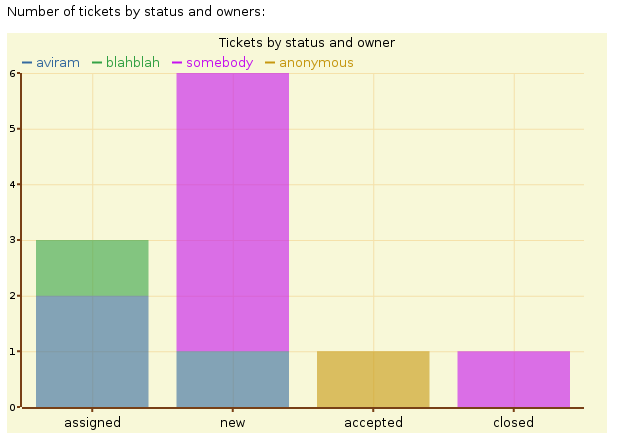
Number of tickets by status and owners:
[[TicketChart(type = stacked_bars, key = owner, x_axis = status, height = 400, width = 600)]]

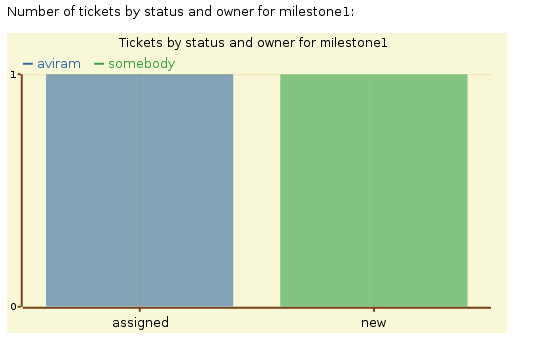
Number of tickets by status and owner for milestone1:
[[TicketChart(type = stacked_bars, key = owner, x_axis = status, query = milestone=milestone1, title = Tickets by status and owner for milestone1)]]

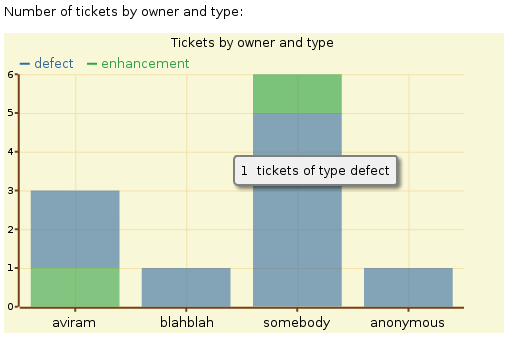
Number of tickets by owner and type:
[[TicketChart(type = stacked_bars, key = type, x_axis = owner)]]

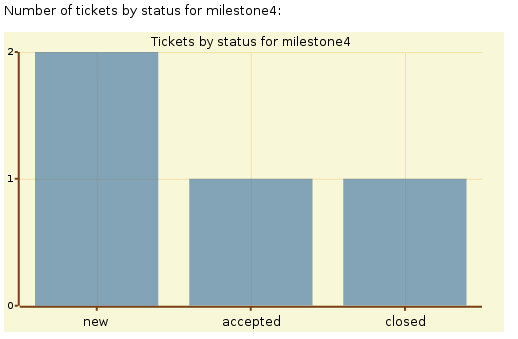
Number of tickets by status for milestone4:
[[TicketChart(type = bars, x_axis = status, query = milestone=milestone4, title = Tickets by status for milestone4)]]

Recent Changes
- 13335 by jun66j5 on 2013-07-17 16:26:41
-
refs #6904: fixed
UnicodeDecodeError,_get_random_stringgenerates a 8-bit string if non en-US locale
- 13250 by rjollos on 2013-05-27 14:50:34
-
Refs #6904, #11072: Refactoring and improved backward compatibility for changes in [13247] and [13248], suggested by Jun Omae (jun66j5).
- 13248 by rjollos on 2013-05-27 12:12:16
-
Refs #11072: Avoid values of 'None' in query string for "clickable link" when value should be an empty string.
(more)
Author/Contributors
Author: aviram
Maintainer: none (deprecated)
Contributors:
Attachments (6)
- pie_by_milestone.png (15.9 KB) - added by 16 years ago.
- pie_by_status.png (13.0 KB) - added by 16 years ago.
- bars_for_milestone4.png (7.2 KB) - added by 16 years ago.
- stacked_bars.png (12.2 KB) - added by 16 years ago.
- stacked_bars_2.png (12.5 KB) - added by 16 years ago.
- stacked_bars_for_milestone1.png (8.9 KB) - added by 16 years ago.
Download all attachments as: .zip