


Contents
Plot Trac Ticket Statistics
Notice: This plugin is unmaintained and available for adoption.
Description
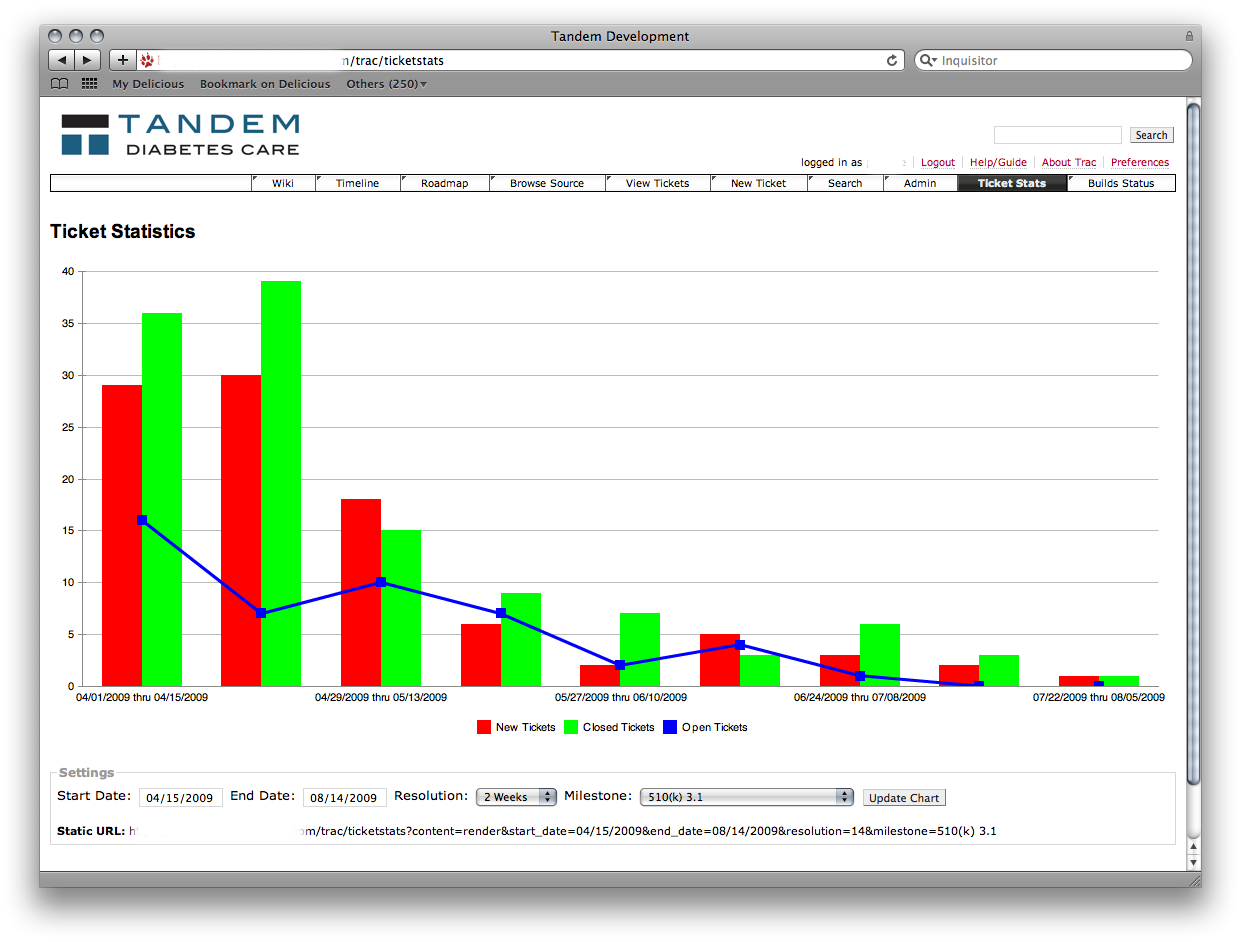
This plugin visualizes Trac ticket statistics. It plots the number of open tickets, the number of new tickets and the number of tickets closed over a time period. It correctly accounts for tickets being reopened and closed during the reporting period, ie by not including them in the total. This plugin uses plotly.js, which itself is MIT-licensed.

The plugin includes a macro that allows a TracQuery to be used as an arguments.
This plugin can be used to visualize the progress of a project by seeing the rate of tickets being created vs. tickets being closed. Graphs can be customized.
The macro allows graphs to be inserted within wiki markup.
[[TicketStats(title = Total tickets last 15 days, height=250, daterange=15d, res_days=1)]]
[[TicketStats(title = Error tickets by week last 3 months, daterange=3m, res_days=7, query=Type='error')]]
The macro's arguments are:
- title: caption to your graph
- height: graph height, default 500 px.
- column_width: default 40 px.
- daterange: date range specified as "from;to" or just "to". Using Trac's 0.12 date field query syntax (trac:wiki:TracQuery?version=20#QueryLanguage).
- res_days: resolution in days for each point in the graph.
See also TracMetrixPlugin.
Bugs/Feature Requests
Existing bugs and feature requests for TracTicketStatsPlugin are here.
If you have any issues, create a new ticket.
| defect |
45 / 51 |
||
|---|---|---|---|
| enhancement |
13 / 18 |
||
| task |
2 / 2 |
Download
Download the zipped source from here.
Source
You can check out TracTicketStatsPlugin from here using Subversion, or browse the source with Trac.
Installation
General instructions on installing Trac plugins can be found on the TracPlugins page.
Add the following to your trac.ini file:
[components]
ticketstats.* = enabled
Configuration
The following options can be specified in trac.ini (default values are shown):
[ticketstats]
; Location of plotly.js
plotly_js_url = //cdn.plot.ly/plotly-latest.min.js
Recent Changes
- 17239 by rjollos on 2018-07-15 01:04:06
-
Tracticketstats 3.0.0dev: Fix typo in template var
Refs #13231.
- 17237 by rjollos on 2018-07-08 20:21:21
-
Tracticketstats 3.0.0dev: Optimize redraw
Refs #13450.
- 17236 by rjollos on 2018-07-08 20:15:24
-
Tracticketstats 3.0.0dev: Modify macro to use
plotly
Refs #13450.
(more)
Author/Contributors
Author: echo0101
Maintainer: none (needsadoption)
Contributors: mixedpuppy (#3900), simon (#3921)
Attachments (1)
-
screenshot01.png (128.8 KB) - added by 16 years ago.
Screenshot of v2.1 on our dev server.
Download all attachments as: .zip