Modify ↓
Opened 13 years ago
Closed 13 years ago
#11255 closed defect (invalid)
Charts are only showing some some results
| Reported by: | Dan Harlacher | Owned by: | aviram |
|---|---|---|---|
| Priority: | normal | Component: | TicketChartsMacro |
| Severity: | normal | Keywords: | |
| Cc: | Trac Release: | 1.0 |
Description
Hello,
I have a couple of charts that only show two columns of the results set. Here is my markup
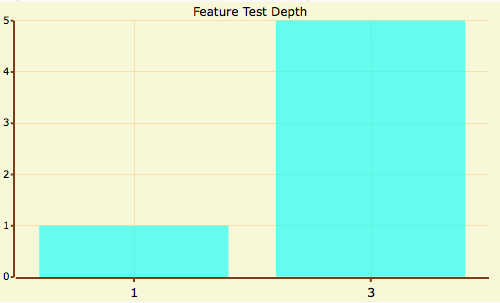
[[TicketChart(type = bars, x_axis = test_depth, query = test_depth="0|1|3|4|5", title = Feature Test Depth)]]
This yields this chart, which only shows results in the 1 and 3 column.
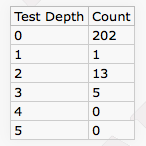
When I run the query manually I get these counts.
||= Test Depth =||= Count =||
|| 0 || [[TicketQuery(test_depth=0, count)]] ||
|| 1 || [[TicketQuery(test_depth=1, count)]] ||
|| 2 || [[TicketQuery(test_depth=2, count)]] ||
|| 3 || [[TicketQuery(test_depth=3, count)]] ||
|| 4 || [[TicketQuery(test_depth=4, count)]] ||
|| 5 || [[TicketQuery(test_depth=5, count)]] ||
I have another chart with the same problem that uses this markup
[[TicketChart(type = bars, x_axis = sub_quality, query = sub_quality="0|meh|quesy|adderall", title = Feature Subjective Quality)]]
Attachments (2)
Change History (4)
Changed 13 years ago by
| Attachment: | testdepthchart.png added |
|---|
Changed 13 years ago by
| Attachment: | realresults.png added |
|---|
comment:1 Changed 13 years ago by
comment:2 Changed 13 years ago by
| Resolution: | → invalid |
|---|---|
| Status: | new → closed |
Sorry, my bad. I removed the quotes and they started to work as expected.
Note: See
TracTickets for help on using
tickets.


A side note, when I change the query to use more than one parameter, using the & I get no results.