


Modify ↓
Opened 8 years ago
Closed 8 years ago
#13452 closed defect (fixed)
Switch from charts.js to plotly.js?
| Reported by: | Peter Suter | Owned by: | lucid |
|---|---|---|---|
| Priority: | normal | Component: | TimeTrackingPlugin |
| Severity: | normal | Keywords: | |
| Cc: | Trac Release: |
Description
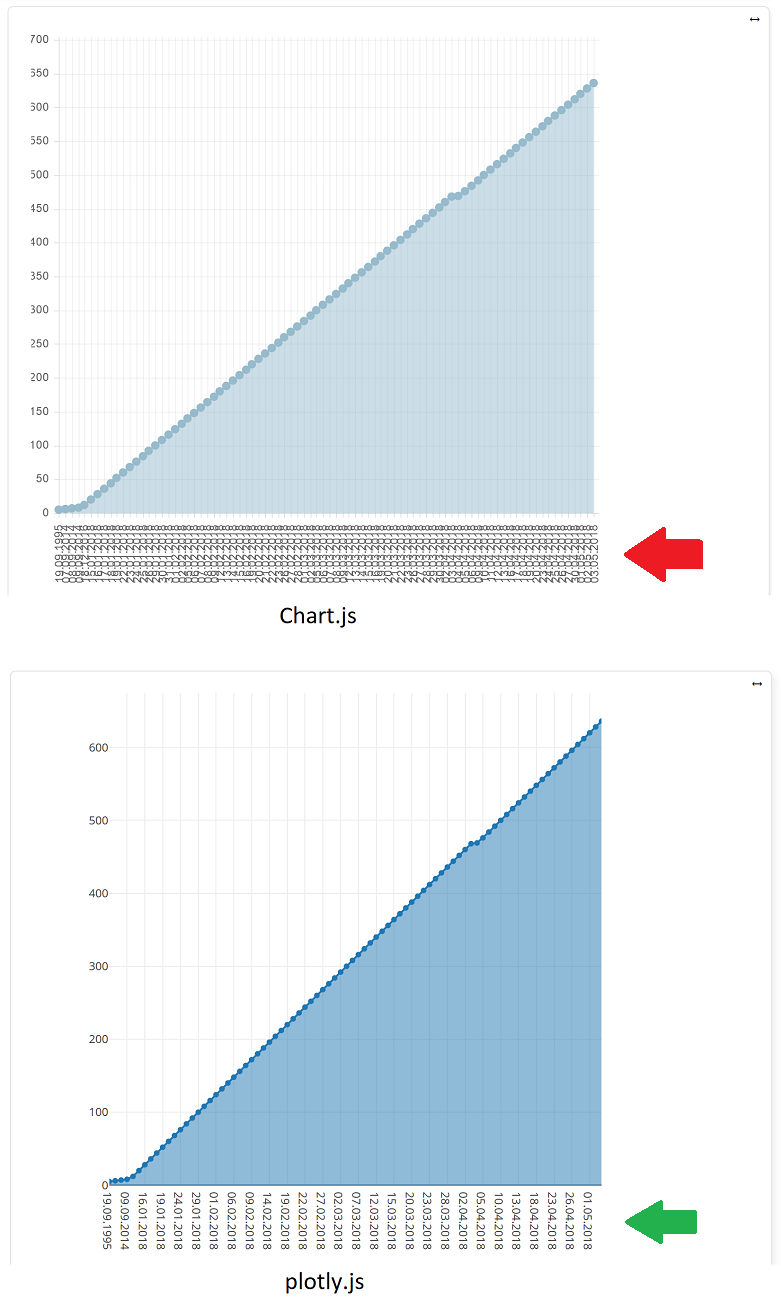
Consider using plotly.js for the charts (like TracYetAnotherChartMacro and TracTicketStatsPlugin).
This might fix the ugly overlapping axis tick labels?
Attachments (1)
Change History (4)
Changed 8 years ago by
| Attachment: | chart-vs-plotly.png added |
|---|
comment:1 Changed 8 years ago by
comment:3 Changed 8 years ago by
| Resolution: | → fixed |
|---|---|
| Status: | new → closed |
Note: See
TracTickets for help on using
tickets.
Yes: