Opened 16 years ago
Last modified 14 years ago
#6186 new enhancement
Possibility to create Burndown chart with mutiple lines
| Reported by: | Owned by: | osimons | |
|---|---|---|---|
| Priority: | normal | Component: | EstimationToolsPlugin |
| Severity: | normal | Keywords: | burndown |
| Cc: | victorhg@…, Filipe Correia, falkb, osimons | Trac Release: | 0.11 |
Description
Hello,
In my company we are trying to use EstimationToolsPlugin - it's working, but we would like to have the possibility to diferenciate tickets by ticket_type attribute.
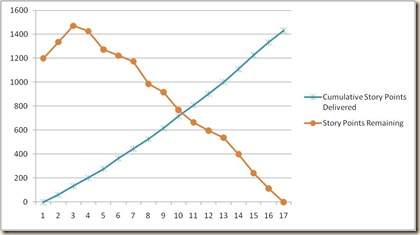
We have a specific type of ticket that represents unplanned activities, and I would like to represent them on another line, just like the following image:
 Link: http://lh4.ggpht.com/_zS5xn0A5mXo/Sk46DLXR_fI/AAAAAAAAACI/t2K4oQEfKF8/chart_thumb%5B1%5D.jpg
One way to represent that would be adding an attribute line_attribute to the burndown line setup:
[[BurndownChart(milestone=Sprint 045, startdate=2009-11-01, enddate=2009-11-13,
     planned_ticket_type=Bug|Enhancement|Task, unplanned_ticket_type=Unplanned)]]
Hope that u consider this feature request.
Thank you
Attachments (1)
Change History (8)
comment:1 Changed 16 years ago by
comment:2 Changed 16 years ago by
| Cc: | Filipe Correia added |
|---|
comment:3 Changed 15 years ago by
I'd like to see as second graph line: the growing of the sum of ticket-field 'total_hours' over all tickets during the time period.
This leads us to a more general approach where one can setup any countable ticket-field as second line.
comment:4 Changed 15 years ago by
| Cc: | falk.brettschneider@… added |
|---|
Hi, my attached patch should solve this ticket and supports a second chart graph line. Please, apply it to SVN trunk!
Given a custom ticket field 'planned' with possible values 0 and 1, then, for example, you can set the following Burndown graph:
[[BurndownChart(milestone=Foo, startdate=2011-04-21,label=planned activities,condfield=planned,cond=1,graph2_field=remaininghours,graph2_label=unplanned activities,graph2_condfield=planned,graph2_cond=0)]]
If you just want to see the growing of the totalhours in a second graph line, you simply set the following. (This solves my own request in comment 3):
[[BurndownChart(milestone=Foo, startdate=2011-04-21,graph2_field=totalhours)]]
The options
- graph2_fieldname defines a ticket field name for the second graph line.
- condfield and graph2_condfield define the ticket field name to be tested for a value.
- cond and graph2_cond define an appropriate value to be tested.
- You can set condfield=myfield,cond=myvalue,graph2_condfield=myfield!,graph2_cond=myvalue to divide a set of tickets into two sets. Note the "!" right beside "myfield" which negates the according condition.
- label and graph2_label set user-defined labels for the burndown chart
Changed 15 years ago by
| Attachment: | additionalsecondgraph+userconditions+userlabels_falkb_patch.diff added |
|---|
patch solving this ticket
comment:5 follow-up: 7 Changed 15 years ago by
| Cc: | osimons added |
|---|
Hi osimons, please review my patch!
comment:6 Changed 15 years ago by
| Owner: | changed from Joachim Hoessler to osimons |
|---|
Hi, osimons, I guess this worth including into trunk. I'm available for further test after into trunk.
[]'s
Adrián
comment:7 Changed 14 years ago by
Replying to falkb:
Hi osimons, please review my patch!
Maybe it's possible to at least commit the 3 helper functions from the patch to trunk. It's the same functionality but more generalized and would not change the current functionality. But it would help to prevent that in the meanwhile the trunk gets incompatible to this patch.
The second part in my patch, the actual extension to multiple lines, uses the 3 functions as prerequisite.


This would be incredibly useful for my project as well.