Contents
Analyze tickets for dependency and other problems
Notice: This plugin is unmaintained and available for adoption.
Description
This is an extensible analysis tool for analyzing tickets in reports. This plugin requires JavaScript and jquery-ui (included) for the dialog modals. This plugin currently has the following built-in analyses:
- Milestone Dependency Analysis - ensures dependent tickets are in current or prior milestones.
- Queue Dependency Analysis - ensures dependent peer tickets in a queue are ordered correctly.
- Project Queue Analysis - ensures dependent child tickets of parent tickets in a queue follow the parents' ordering.
- Project Rollup Analysis - summarizes (or rolls up) the child tickets' fields in the parent ticket.
All of the analyses above build upon the master tickets plugin. The second and third analyses also build upon the queues plugin. Be sure to use the latest version of the queues plugin so that the included jquery-ui versions match to avoid conflicts!
When an analysis is enabled for a report, an Analyze... button appears at the top of the report, which will present the user with the following dialog box:
Examples
The four analyses can be individually enabled for one or more reports. Each analysis is configured by modifying the [analyze] section of trac.ini, see below for examples. When an analysis is enabled for a report, an Analyze... button appears at the top of the report and the analysis' name will appear in the subsequent dialog box when the button is clicked. You can either choose a single analysis or all analyses in this dialog box. Selecting "All" will run them serially.
Note: The current analyses do not, for example, detect circular dependencies nor can they handle complex relationships all in one pass. This means that after a pass of fixes, the changes may have caused or exposed other issues that another analysis pass will uncover. So the general usage pattern is to continue re-running analyses until "quiescence" is reached, ie until there are no more issues to fix.
Milestone Dependency Analysis
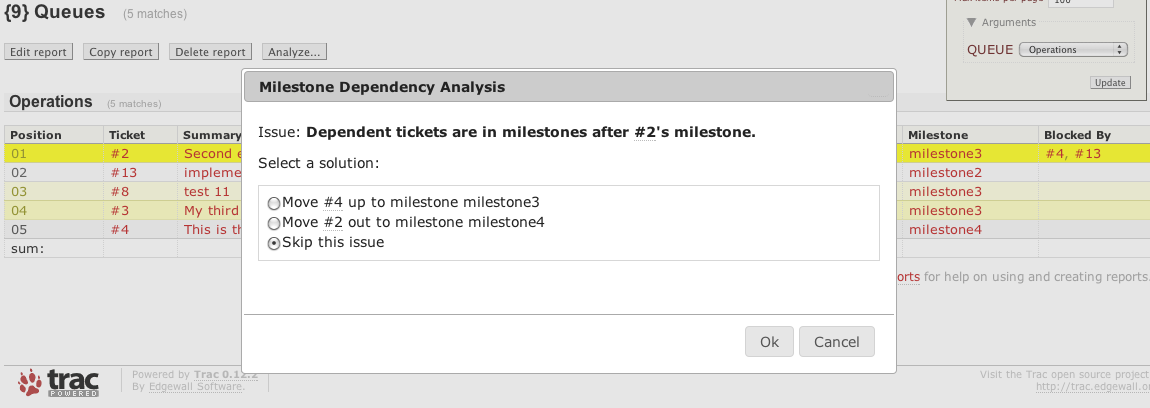
The popular master tickets plugin enables specifying dependencies amongst tickets and visualizes them via Graphviz. However, the plugin doesn't include support to manage these dependencies, such as detecting when tickets are scheduled out of order. That's where this Milestone Dependency Analysis comes in:
This analysis detects when a ticket in a given report has a dependency (a blockedby ticket) that is in a future milestone or not scheduled in any milestone. This works with either of the following semantics for blockedby tickets:
blockedbytickets are peer ordering relationshipsblockedbytickets are project (aka parent-child) relationships, where the parent/project's milestone is the latest milestone for the work to be completed
To enable this analysis for a given report, list those reports in trac.ini as follows:
[analyze]
milestone_reports = 1,9
Detected problems are shown with an option to automatically fix the problem by moving tickets into appropriate milestones, see screenshot above.
Queue Dependency Analysis
The queues plugin converts one or more reports into work queues. These queues enable you to drag and drop tickets above and below one another signifying their relative priority. Each ticket's relative position is maintained in a custom field usually named position, but can be named anything. Dependencies amongst peer tickets in a work queue have similar problems as tickets across milestones, in this case a dependent ticket should precede, ie appear higher in the queue, which means have a lower position value. However, it can be difficult to manually catch all of these dependency violations. That's where this Queue Dependency Analysis comes in:
This analysis detects when a ticket in a given report has a dependency, for example a blockedby ticket, whose position comes after this ticket's or has no position yet at all, or is not in the correct queue. To enable this analysis for a given report, list those reports in trac.ini as follows:
[analyze]
queue_reports = 2,9
queue_fields = queue,milestone
The queue_fields (optional) above tells this analysis what fields (if any) define (i.e., segment) a queue. Queues can be defined by zero or more fields such as the milestone field, a custom queue field, both or other fields. If you have different reports using different definitions, you can define report-specific queue field definitions as follows:
[analyze]
queue_fields.9 = queue
In this example, report 2 uses both queue and milestone fields to define a queue whereas report 9 uses only the queue field. You may also specify additional filters to skip tickets with certain field values (pipe-delimited):
[analyze]
queue_fields.9 = queue,type!=epic,phase!=verifying|releasing
In this example, the queue field defines the queue in report 9 and the analysis will skip any ticket in this queue with type equal to "epic" or phase equal to "verifying" or "releasing". These would typically match the WHERE clause in the report's SQL.
Detected problems are shown with an option to automatically fix the problem by moving tickets above or below each other in the queue, see screenshot above.
Project Queue Analysis
This analysis is for project queues rather than work queues, meaning that the dependency semantics is parent-child. For example, you may have a report of project (or "epic" in agile-speak) tickets whose sub-tasks are represented in their blockedby dependencies. Re-prioritizing a project/epic/parent ticket does not automatically re-order their child tickets, respectively. That's where this Project Queue Analysis comes in:
This analysis will enforce that the child tickets (usually found in a separate work queue report) are ordered relative to one another in the same general order as the parent/project tickets. To enable this analysis for a given report, list those reports in trac.ini as follows:
[analyze]
project_reports = 19
project_type = epic
refresh_report = 9
queue_fields.19 = queue,milestone,type!=epic,phase!=verifying|releasing
The project_type option above is the ticket type of your projects, eg "epic" (the default), "project", etc. Project tickets must be of this type.
The default behavior of an analysis is to refresh the current report if any fixes were made. This is so that changes can be viewed, assuming they would change the content of the report. In the case of the Project Queue Analysis you would usually also need another report refreshed, ie the impacted work queue. Use the refresh_report option to specify this impacted work queue which will also get refreshed at the end of this analysis if there were any fixes. You can add parameters to the report as well if needed:
[analyze]
refresh_report = 9?max=1000
This analysis uses the same queue fields configuration as the Queue Dependency Analysis above.
Detected problems are shown with an option to automatically fix the problem by moving the sub-task/child tickets above or below each other in their queue to match their parent's relative positions, see screenshot above.
Project Rollup Analysis
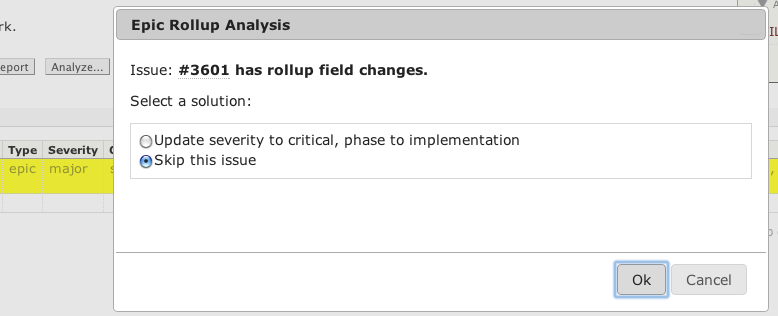
This analysis summarizes a project by "rolling up" its child tickets using one of several statistical methods. For example, you may have a report of project (or "epic" in agile-speak) tickets whose sub-tasks are represented in their blockedby dependencies. You would like each project ticket's fields to summarize (or roll up) those of its child tickets. That's where this Project Rollup Analysis comes in:
To enable this analysis for reports, list those reports in trac.ini as follows:
[analyze]
rollup_reports = 1,2,3,9
In the example above, this analysis is available for reports 1, 2, 3, and 9. If no rollup_reports is provided, then the project_reports list is used instead.
The available rollup stats are:
- sum
- min
- max
- median
- mode
- pivot
All but pivot apply to numeric fields, and all but sum apply to select option fields. Here are several examples of specifying a stat for different fields:
[analyze]
rollup.effort = sum
rollup.severity = min
rollup.captain = mode
rollup.phase = implementation
In the example above the project's:
effortfield sums all of its children numeric valuesseverityfield gets set to the minimum (index) value of its childrencaptainfield gets set to the most frequent captain of its childrenphasepivots on the "implementation" select option value
In brief, the pivot algorithm is as follows (using the option's index):
- if all values are smaller than the pivot value, then select their maximum value
- else if all are larger than the pivot value, then select their minimum value
- else select the pivot value
Detected changes to rollup field values are shown with an option to automatically update the value, see screenshot above.
Tips and hints
A few ideas to optimize your analysis experience:
- If this tool's ticket changes generate emails that are of little value to your team, then you can suppress them by enabling "Quiet Mode" using the QuietPlugin.
- Use TicketQuery in a project/epic's description to see all of its sub-tasks/children. Here is an example that allows you to order by position as the first column and the ticket id as the second. The
1234is the project/epic's ticket number:[[TicketQuery(blocking~=1234,format=table,col=position|id|summary|severity|owner|effort|milestone|phase,order=position,group=type)]]
- The core analyses are maintained in Python modules that require no imports. This was intentional so that they may be easily wrapped and called from a monitoring script, eg nagaconda for nagios, so that you can be proactively alerted to ticket scheduling issues without needing to manually run analyses in Trac.
Extensibility (implementation details)
Each analysis is implemented as a Trac extension point to allow for new analyses to be added fairly easily. See analysis.py for the IAnalysis interface. In brief, you only need to define two methods for each analysis:
can_analyze(self, report)- returnsTrueif this analysis can analyze the given reportget_solutions(self, db, args)- return a dict ofnameanddatafields, or a list of these, that each define a solution option for how to fix the detected issue.
where args are the request args and data is any serializable (to JSON) Python object that contains all of the data needed to automatically fix the problem. If this data object is a dict of ticket fields and their new values (or a list of these), then the default fix_issue() method will automatically apply the fix upon user command. If your fix is more involved, you can override this method:
fix_issue(self, db, data, author)- fix the issue using the data that was returned earlier fromget_solutions().
See the code for examples and other smaller tweaks to the IAnalysis interface and base Analysis class.
Bugs/Feature Requests
Existing bugs and feature requests for AnalyzePlugin are here.
If you have any issues, create a new ticket.
Download
Download the zipped source from here.
Source
You can check out AnalyzePlugin from here using Subversion, or browse the source with Trac.
Installation
- Download and unzip the plugin.
- Install the plugin:
cd analyzeplugin/0.12
sudo python setup.py bdist_egg
sudo cp dist/TracAnalyze*.egg /your/trac/location/plugins/
See TracPlugins for more installation details and options. You'll likely need to restart Trac's web server after installation.
- Enable the plugin by adding the following to your
trac.inifile:[components] analyze.* = enabled
You can alternatively use the Trac Web Admin GUI to enable any or all rules.
Configuration
Enable the ANALYZE_VIEW permission for those users who are allowed to execute analyses.
Recent Changes
Author/Contributors
Author: robguttman
Maintainer: none (needsadoption)
Contributors:
Attachments (5)
- ask_analyze.png (62.8 KB) - added by 14 years ago.
- issue-milestone.png (71.8 KB) - added by 14 years ago.
- issue-queue.png (60.9 KB) - added by 14 years ago.
- issue-project.png (53.5 KB) - added by 14 years ago.
- rollup-project.png (30.0 KB) - added by 14 years ago.
Download all attachments as: .zip


