


| Version 5 (modified by , 12 years ago) (diff) |
|---|
Contents
Graphs tables and other data using Google Visualization API
Notice: This plugin is unmaintained and available for adoption.
Description
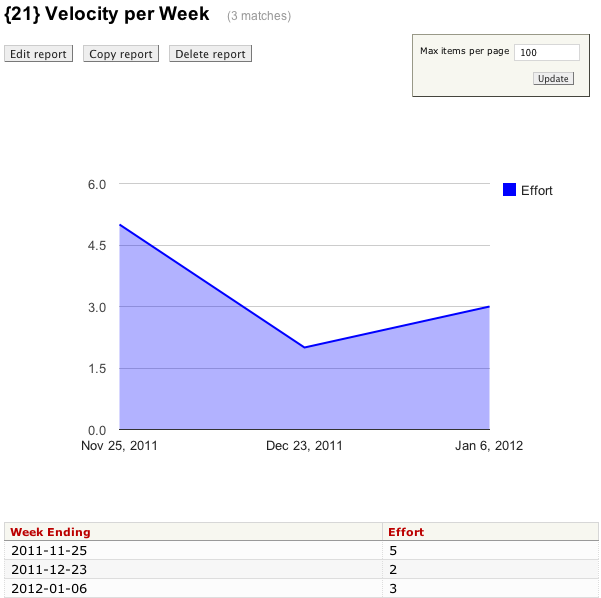
This plugin adds Google Visualization graphs and charts to Trac pages. The most basic usage is graphing an existing report:

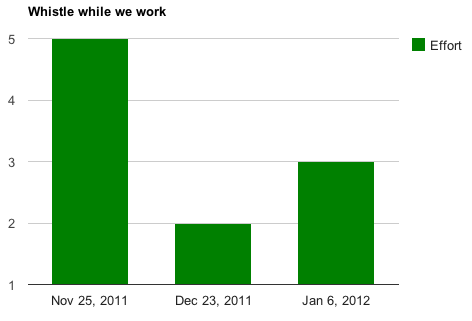
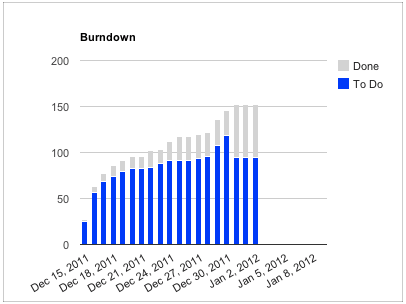
See more examples below.
Configuration
- Install the plugin (after downloading and unzipping):
cd visualizationplugin/0.12
sudo python setup.py bdist_egg
sudo cp dist/TracVisualization*.egg /your/trac/location/plugins/
See TracPlugins for more installation details and options. You'll likely need to restart Trac's web server after installation.
- Enable the plugin:
[components]
viz.* = enabled
You can alternatively use the Trac Web Admin GUI to enable any or all rules.
- Configure which pages to include graphs - example:
[viz]
reports = 7
The above example will populate an area chart from the table of data found in report 7 and display the chart above that table - see screenshot above. The examples section below shows additional ways to include graphs and charts on Trac pages.
Bugs/Feature Requests
Existing bugs and feature requests for VisualizationPlugin are here.
If you have any issues, create a new ticket.
Download
Download the zipped source from [download:visualizationplugin here].
Source
You can check out VisualizationPlugin from here using Subversion, or browse the source with Trac.
Example
- table
- remote
Recent Changes
Author/Contributors
Author: robguttman
Maintainer: robguttman
Contributors:
Attachments (3)
- effort.png (36.0 KB) - added by 12 years ago.
- whistle.png (12.9 KB) - added by 12 years ago.
- burndown.png (22.9 KB) - added by 12 years ago.
Download all attachments as: .zip