Contents
Produce graphical images of the structure of XML Schema files
Description
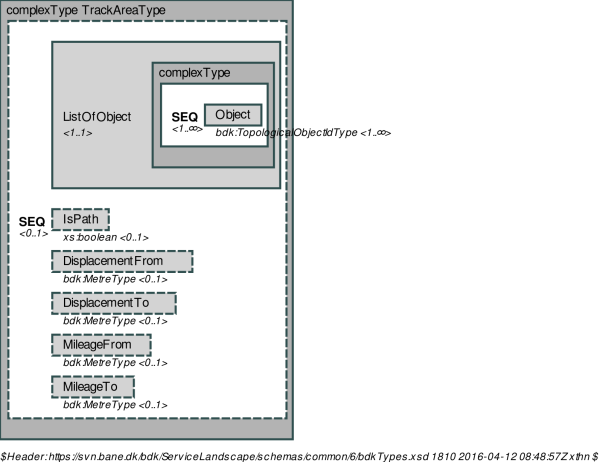
This plugin produces a graphical depiction of the data structure defined by an XML Schema (XSD) file.
Input files can be source files in an SVN repository, attachments to tickets or placed in the Trac server file system.
Output is as indicated in this example:
The plugin contains code allowing it to be called from a command line / a script.
Bugs/Feature Requests
Existing bugs and feature requests for TracXsdPlotMacro are here.
If you have any issues, create a new ticket.
| defect |
0 / 2 |
||
|---|---|---|---|
| enhancement |
6 / 7 |
||
| task |
1 / 1 |
Download
Download the zipped source from here.
Source
You can check out TracXsdPlotMacro from here using Subversion, or browse the source with Trac.
Installation
General instructions on installing Trac plugins can be found on the TracPlugins page.
Requirements:
ImageMagickmust be installed - used to convert SVG images to PNGElementTreemust be installed for XSD parsing.
Enable the plugin as follows in your trac.ini file:
[components]
tracxsdplot.* = enabled
Tested with Trac 1.0.15 and 1.2.3 on Linux. Trac versions older than 1.0.6 cannot access specific source file revisions.
Configuration
Create the following stanza in your trac.ini file:
[tracxsdplot]
file.prepath = /relative/entry/directory
file.preurl = http://example.com/entrydir
png-density = 600
colour.element = #D3D3D3
colour.complextype = #B3B3B3
colour.container = #FFFFFF
colour.stroke = #2F4F4F
The attributes have the following meaning:
| file.prepath | Path prefix for local files |
| file.preurl | URL prefix |
| png-density | pixel density for generated PNG images (used as parameter to ImageMagick)
|
| colour.element | RGB colour used for <xs:element> |
| colour.complextype | ... for <xs:complexType> |
| colour.container | ... for <xs:sequence>, <xs:all>, <xs:choice> |
| colour.stroke | ... for box frames |
The plugin contains functionality that allows command-line usage as well:
$ /path/to/plugin/xsd2svg XSDFILE --outfile=OUTFILE
Usage
[[XsdPlot(schema.xsd,width=400,page=100,caption="Page 100 from Book Example")]]
[[XsdPlot(source:repo/schema.xsd@10,width=600,caption="SVG-image from repository in version 10")]]
[[XsdPlot(ticket:1:schema.xsd)]]
Possible Trac links for input files/resources
| Trac link | Alternatives | Comment |
|---|---|---|
| wiki: | JustPageName | Wiki page attachment |
| ticket: | #1 | Ticket attachment |
| source: | browser,repos | File stored in Subversion |
| file: | Local file. Path prefix read from file.prepath in trac.ini
|
XSD layout selectiveness control parameters
| Parameter | Value | Default |
|---|---|---|
| top-element | Pipe-separated list of XSD elements to plot. Elements can pe placed anywhere in the DOM. Or *, which will plot every top-level element and complexType | *
|
| depth | maximum depth counted in elements | infinity |
| stop-list | pipe-separated list of XSD element names where recursive descent shall stop | empty |
Other parameters
| Parameter | Value | Default | Note |
|---|---|---|---|
| img-type | 'png' or 'svg' | svg | Case insensitive |
| width | width in pixel | 600 | Must be absolute value |
| caption | caption under image | none | |
| label | anchor to link to | ||
| cache | build once or each time | True | Time consumption or changing vector graphics |
| align | left|right | nothing |
Recent Changes
- 17313 by thenor on 2018-12-05 19:37:34
-
Fix #13440 - whitespace removed and #13506 - allow multiple toplevel elements. And code cleaned a bit up but is still very messy.
- 15672 by thenor on 2016-07-27 08:24:33
-
fix #12585, #12586, #12669, #12783. Bump version to 1.1
- 14868 by thenor on 2015-08-10 20:45:16
-
Fix 12475: Added 3-clause BSD licence and other metadata according to DevGuide
(more)
Author/Contributors
Author: thenor
Maintainer: Theodor Norup
Contributors:
Credits
Thanks to ursaw for most of the macro argument parsing and Trac infrastructure that is taken from PdfImagePlugin.
Attachments (2)
-
trac-hacks-example.png (88.2 KB) - added by 11 years ago.
Example image
-
trac-hacks-example_1.1.png (133.1 KB) - added by 10 years ago.
Example plot from V1.1
Download all attachments as: .zip


