


| Version 30 (modified by , 10 years ago) (diff) |
|---|
Contents
Plugin to render burndown SVG images
Notice: This plugin is unmaintained and available for adoption.
Links: open # | new # | svn | browse
Description
This component draws customizable burndown graphs from ticket history provided by TimingAndEstimationPlugin. Dynamic graphs can be easily embedded to wiki pages.
Developed and tested with Trac 0.10.4, Python 2.4, sqlite, mod_python and Apache on Windows. The 0.6 version works on Trac 0.11.
Bugs/Feature Requests
Existing bugs and feature requests for TimeVisualizerPlugin are here.
If you have any issues, create a new ticket.
| defect |
7 / 11 |
||
|---|---|---|---|
| enhancement |
1 / 8 |
||
| task |
3 / 3 |
Installation
Dependencies: TimingAndEstimationPlugin was needed in 0.4 and earlier versions to feed database with estimates and totalhours custom tickets. Browser must render SVG natively and support the html tag iframe. Latest Firefox, Opera and Safari browser versions should work.
- Get source installation & install it
svn co http://trac-hacks.org/svn/timevisualizerplugin/branches/TimeVisualizer_0.6 cd TimeVisualizer_0.6 python setup.py install - Edit your
trac.inifile and modify components section:[components] <...other components...> tractimevisualizerplugin.* = enabled
- Restart server to propagate changes.
For details, see browser:/timevisualizerplugin/branches/TimeVisualizer_0.6/release_notes.txt
Usage
To test graphs & filtering, access "http://server:port/path_to_trac_env/tractimevisualizer". It will render hours from whole project life cycle.
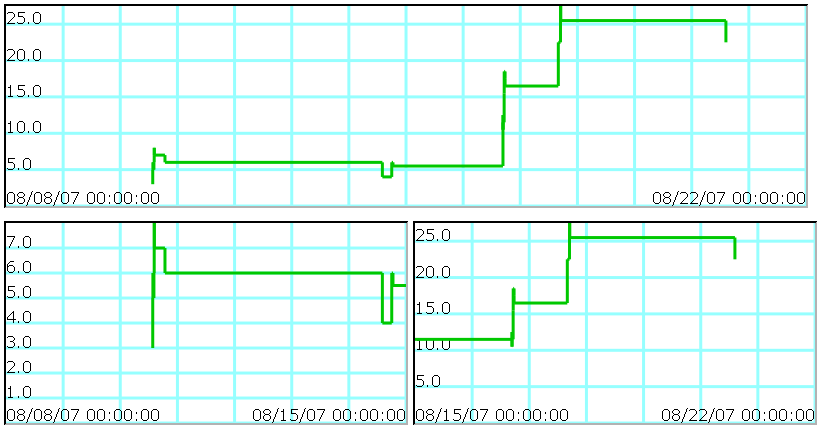
More practical is to get graphs from some certain time frame and filter hours based on milestone and/or component. This is achieved with macro BurnDown (wrote this plugin to replace ScrumBurndownPlugin because its graphing capabilities were limited and it modifies the database schema).
In my example project, I have wiki page with following content:
[[BurnDown(width=800,height=200,query=targetmilestone=mile1&datestart=08/8/07&dateend=8/22/07)]]

[[BurnDown(width=400,height=200,query=targetmilestone=mile1&datestart=08/8/07&dateend=8/15/07)]]
[[BurnDown(width=400,height=200,query=targetmilestone=mile1&datestart=08/15/07&dateend=8/22/07)]]
It renders the following graphs (picture is cropped to fit better on this page)


For more, see browser:/timevisualizerplugin/branches/TimeVisualizer_0.6/release_notes.txt
Feedback
Recent Changes
- 14861 by rjollos on 2015-08-06 02:37:43
-
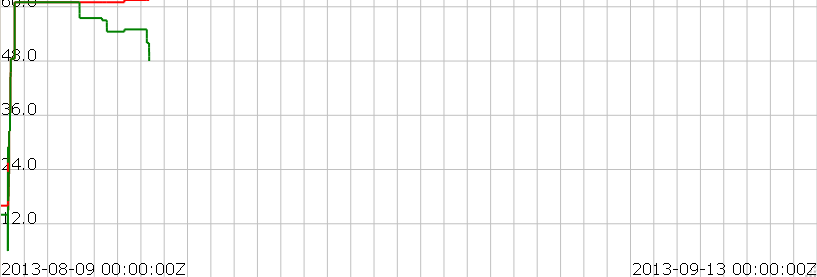
0.7: Adds support for multiple lines and makes it possible to specify the color and with of the lines and the grid.
This is an untested patch that was previously attached the project wiki page.
- 14860 by rjollos on 2015-08-06 02:37:36
-
0.7: Created branch for 0.7.
- 3323 by mape on 2008-03-07 17:01:28
-
Applied patch, which fixes logging issue with cgi frontend, closes #2666
- 3317 by mape on 2008-03-06 08:30:33
-
set svn eol style to native (patches should be then cross platform compatible)
- 3316 by mape on 2008-03-06 08:27:13
-
layout change: using branches instead of tags (because published versio may need changes)
(more)
Author/Contributors
Author: mape (thtv08 _at_ gmail.com)
Maintainer: none (needsadoption)
Contributors:
Attachments (2)
-
TracTimeVisualizerPlugin_ss1.PNG (22.5 KB) - added by 18 years ago.
example burndowns
-
0.7_screenshot.png (15.2 KB) - added by 12 years ago.
0.7 screenshot with multiple lines
Download all attachments as: .zip